


When it comes right down to it, most machine learning tasks largely take the form of a classification problem – that is, recognizing, identifying, and appraising the categories to which particular data points belong. However, we don’t always have categories or labels to definitively assign. Sometimes all we have is a bunch of data whose individual data points need to, in one way or another, be grouped in with other data points that appear somewhat similar. Building data points isn’t always easy, especially when you’re just beginning. Ploomber allows you to build data pipelines in a streamlined, simple, and fast manner. See how you can use Ploomber to build your own data pipelines.
Clustering essentially refers to this exact process: the division of data into groups for purposes of classification. This almost always takes the form of an unsupervised task (i.e. a task that doesn’t rely on definitive labels through which we can guide – or supervise – a given model), meaning that all we really give the model we build is our data.
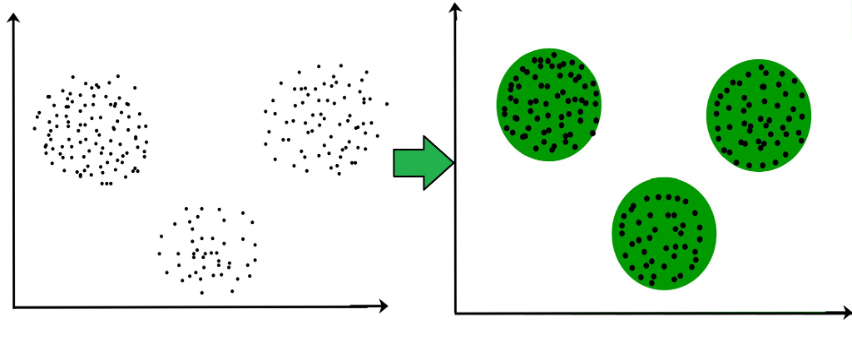
In the above image, on the left is our unclassified data. On the right, it has been grouped into clusters. Any new data points that the model is exposed to will be associated with a given cluster depending on where it falls on the graph. Source.
Clustering tasks can be found in almost every field, but they are most commonly found in industries like business and marketing, where you find yourself wanting to analyze customer preferences to do things like recommending specific products or exposing users to the ads they are most likely to be interested in and click on.
For example, if you’re a clothing company and want to recommend clothes for your customers, you might cluster them based on their clothing preferences. Then, when a new customer comes into the store, you can find out what kinds of clothes they usually wear and make appropriate recommendations. This kind of technology is present in all of our lives – on Instagram, on Facebook, in video games, et cetera.
There are a number of different techniques and algorithms by which clustering is done. We explore some of them below with a level of details corresponding to how commonly they are generally used in industry and academia.
Techniques that work best on data that features highly dense grouped regions and less dense, less populated regions are referred to as density-based methods. These are fairly effective, but they do have some drawbacks, like the fact that they rely on the specific density of your data.
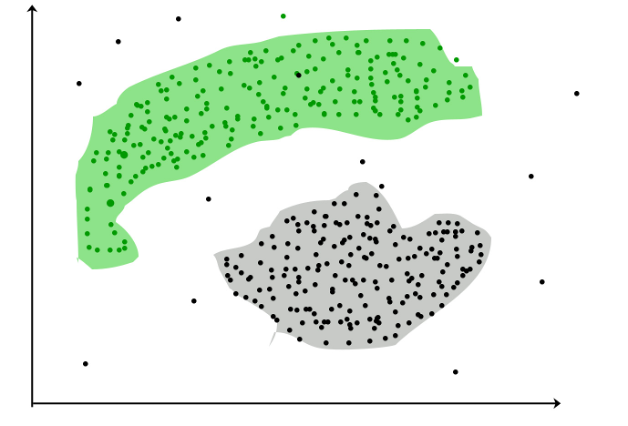
Here’s an example of density-based clustering. As you can see, clusters were grouped together based on the high density of their surrounding data points. Source.
Another way of going about this is to create a hierarchy of distances between data points and then cluster them according to proximity within the tree. Consider this diagram:
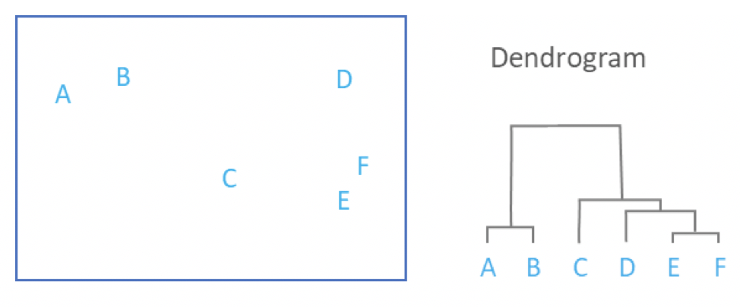
In the above image, on the left you see our various data points graphed out. On the right, you see a tree structure describing their proximities. A hierarchical clustering method may create an AB and a CDEF cluster, depending on its specific parameters. Source.
This approach exploits the fact that clusters are characterized by a centroid, i.e. a central vector, and that data points tend to be assigned to clusters whose centroids they are closest to. Most of these techniques essentially analyze their data on the basis of various properties or distance metrics and then assign data points to specific clusters depending on the centroids they are most often closest to.
Centroid-based clustering is one of the most common methods employed, and some of the most popular algorithms you’ll find in industry and academia alike utilize this approach.
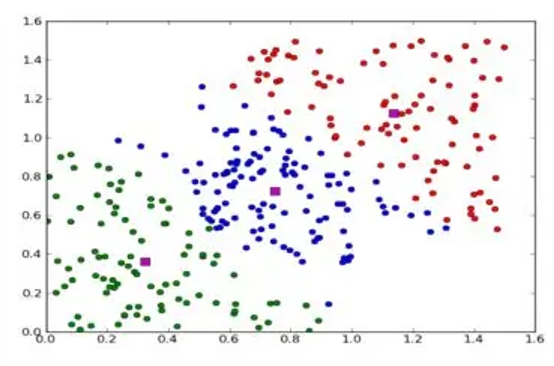
In the above image, in pink, you can see the centroids of three different clusters. In green, blue, and red, you can see the datapoints of each cluster. Source.
As the name might suggest, grid-based clustering begins with the drawing of a grid made up of a finite number of cells over your data. From there, the exact methodology can vary depending on the specific implementation used, but one way or another, squares are either selected or not selected for inclusion in clusters.
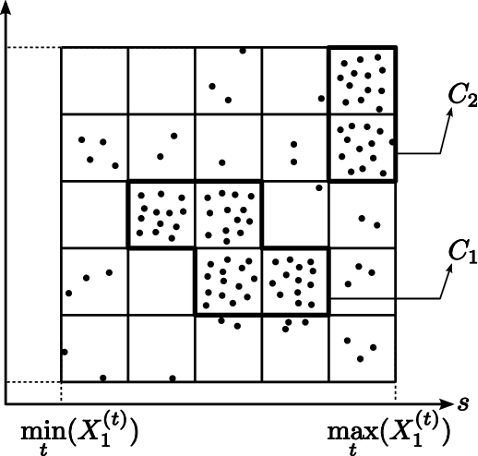
The above image is an example of a grid-based clustering technique using a density-based selection filter. Source.
As was hinted at above, centroid-based algorithms are very common and you’ve likely run into more real-world applications of this approach than any other. K-means clustering is the most popular centroid-based algorithm of all and sees use in everything from diagnostic imaging to scientific research, and if you’ve taken any introductory machine learning classes, chances are that you’ve run into it.
First devised by researchers working on signal processing, K-means essentially aims to minimize the variance of all data points in a given cluster – meaning it runs your data through a number of different variations and uses its findings to create the most optimal clusters possible.
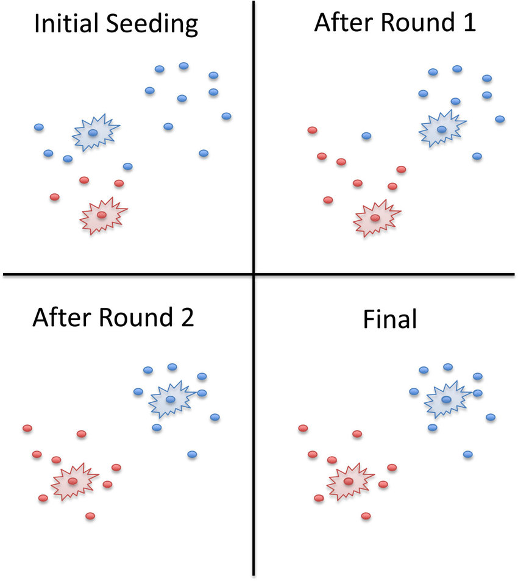
In this example, a K-means algorithm was given two rounds to optimize the data clusters. The red and blue dots represent data points, while the red and blue bursts represent different cluster seeds (for all intents and purposes, different centroids). Source.
Machine learning is often thought to be a difficult field full of esoteric concepts that the average person could never hope to understand, but it is our hope that this tutorial has made one of its core concepts digestible enough for you to understand that it is ultimately a field founded on coherent principles that anyone can navigate given enough time and a good enough explanation.
Clustering is a key pillar of machine learning, and a comprehensive understanding of its principles and the various approaches to it that people have uncovered is crucial if you want to make sensible decisions both in designing your model and in picking the right solution for your particular application to begin with. We hope that the idea is a little clearer to you now, and that you’ve gained a meaningful understanding of the basics behind the most common clustering techniques. If you’d like to get your data pipelines set up to make use of cluster analysis, we offer a simple and easy way to do that. Ploomber is a flexible and extensible tool that allows you to simply and easily get your data pipelines up and running and analyzable. Welcome to check us out on GitHub.
Seamless deployment for data scientists and developers. Ploomber handles infrastructure so you focus on building. Secure and scalable—from personal projects to enterprise apps. Support for Streamlit, Dash, Docker, and AI-powered applications. Because life's too short for deployment headaches.

