


In this guide, I’ll show you how to configure VSCode for debugging a Dash app. From basic setup to breakpoints and variable exploration, this tutorial will streamline your debugging process.
Let’s start by writing a simple Dash app.
import dash
from dash import dcc, html
from dash.dependencies import Input, Output

app = dash.Dash(__name__)

app.layout = html.Div([
    dcc.Input(id='input-box', type='text'),
    html.Button('Submit', id='button'),
    html.Div(id='output-div')
])

@app.callback(
    Output('output-div', 'children'),
    [Input('button', 'n_clicks')],
    [dash.dependencies.State('input-box', 'value')]
)
def update_output(n_clicks, value):
    return f'You entered: {value}'

if __name__ == '__main__':
    app.run_server(debug=True)
This application can be run from the terminal using the below command:
python dash_app.py
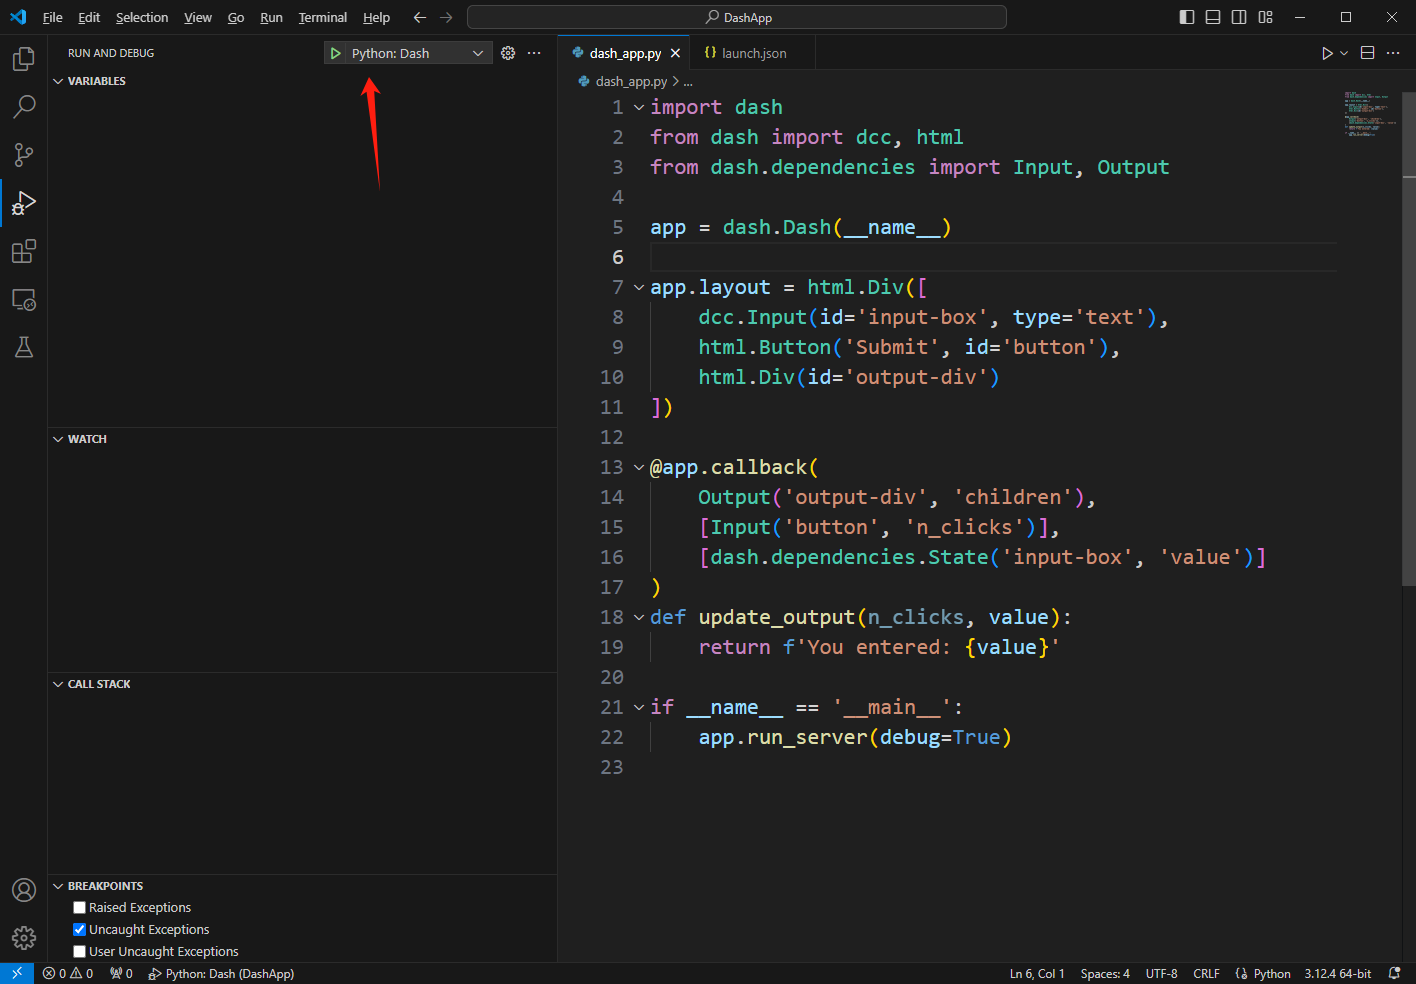
Let’s now open VSCode and click on the “Run and Debug” button, shown in the image below:
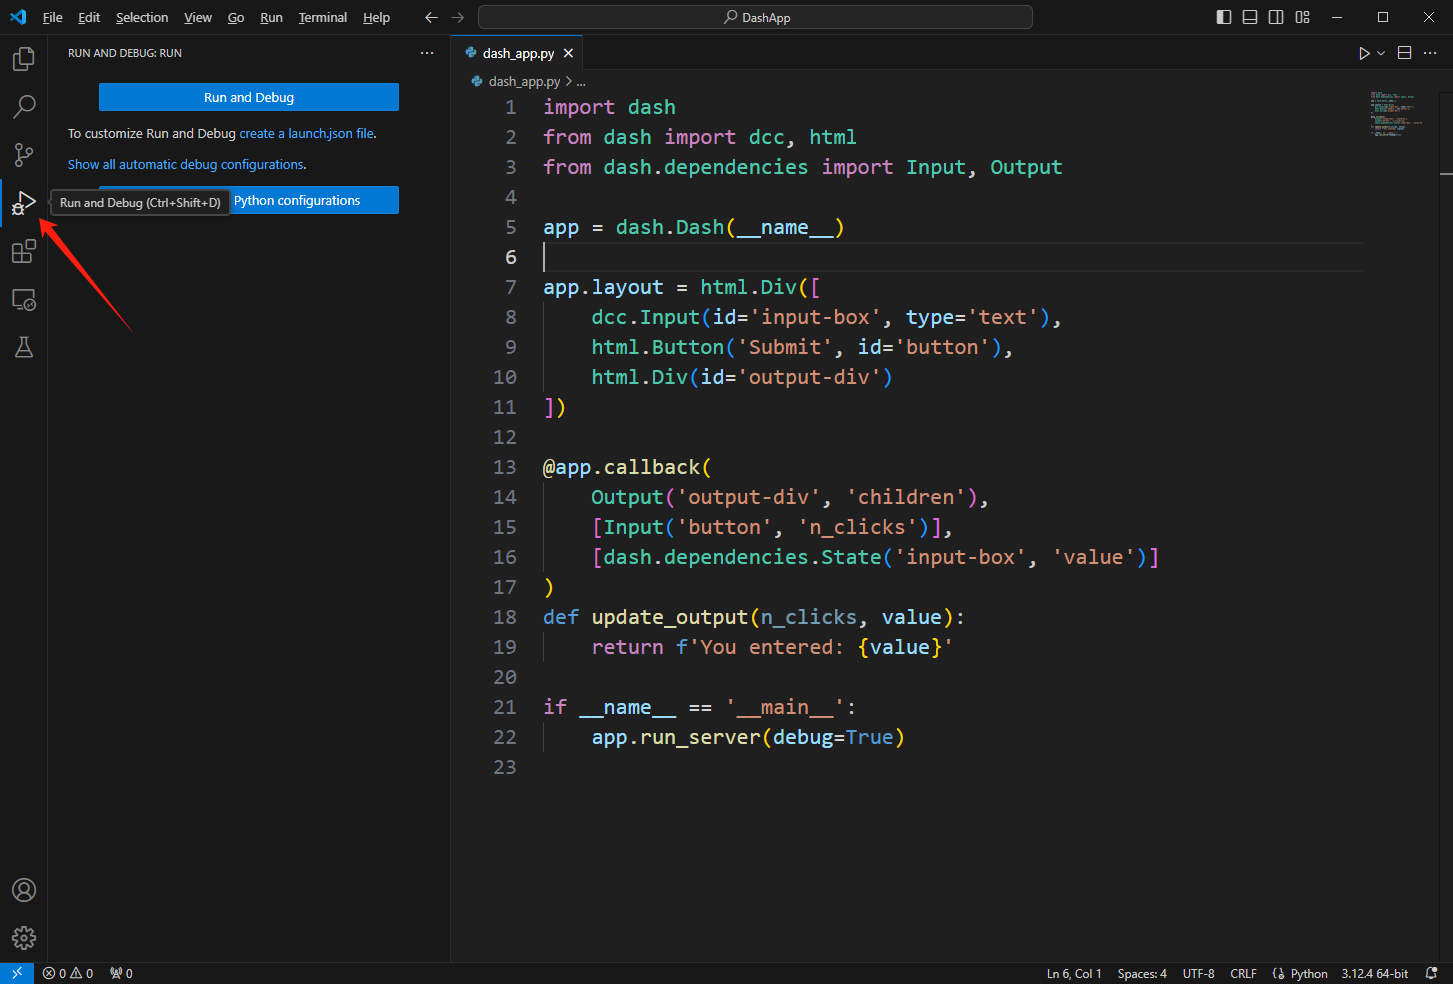
You’ll see under the button, it says:
To customize Run and Debug, create a launch.json file.
Click on:
create a launch.json file
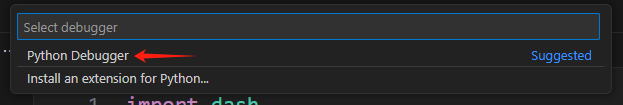
Then, select Python Debugger, shown below:
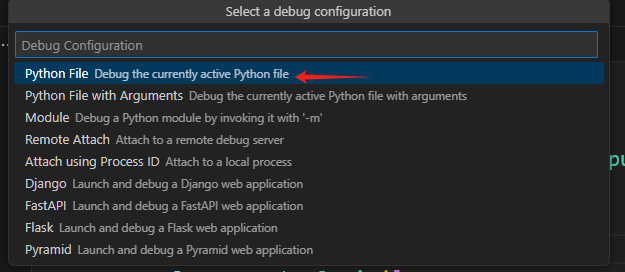
Then, select Python File:
A launch.json file will open. Replace its contents with the following:
{
    "version": "0.2.0",
    "configurations": [
        {
            "name": "Python: Dash",
            "type": "debugpy",
            "request": "launch",
            "program": "${workspaceFolder}/dash_app.py",
            "args": [],
            "console": "integratedTerminal"
        }
    ]
}
Save the changes. And your VSCode should look like this:
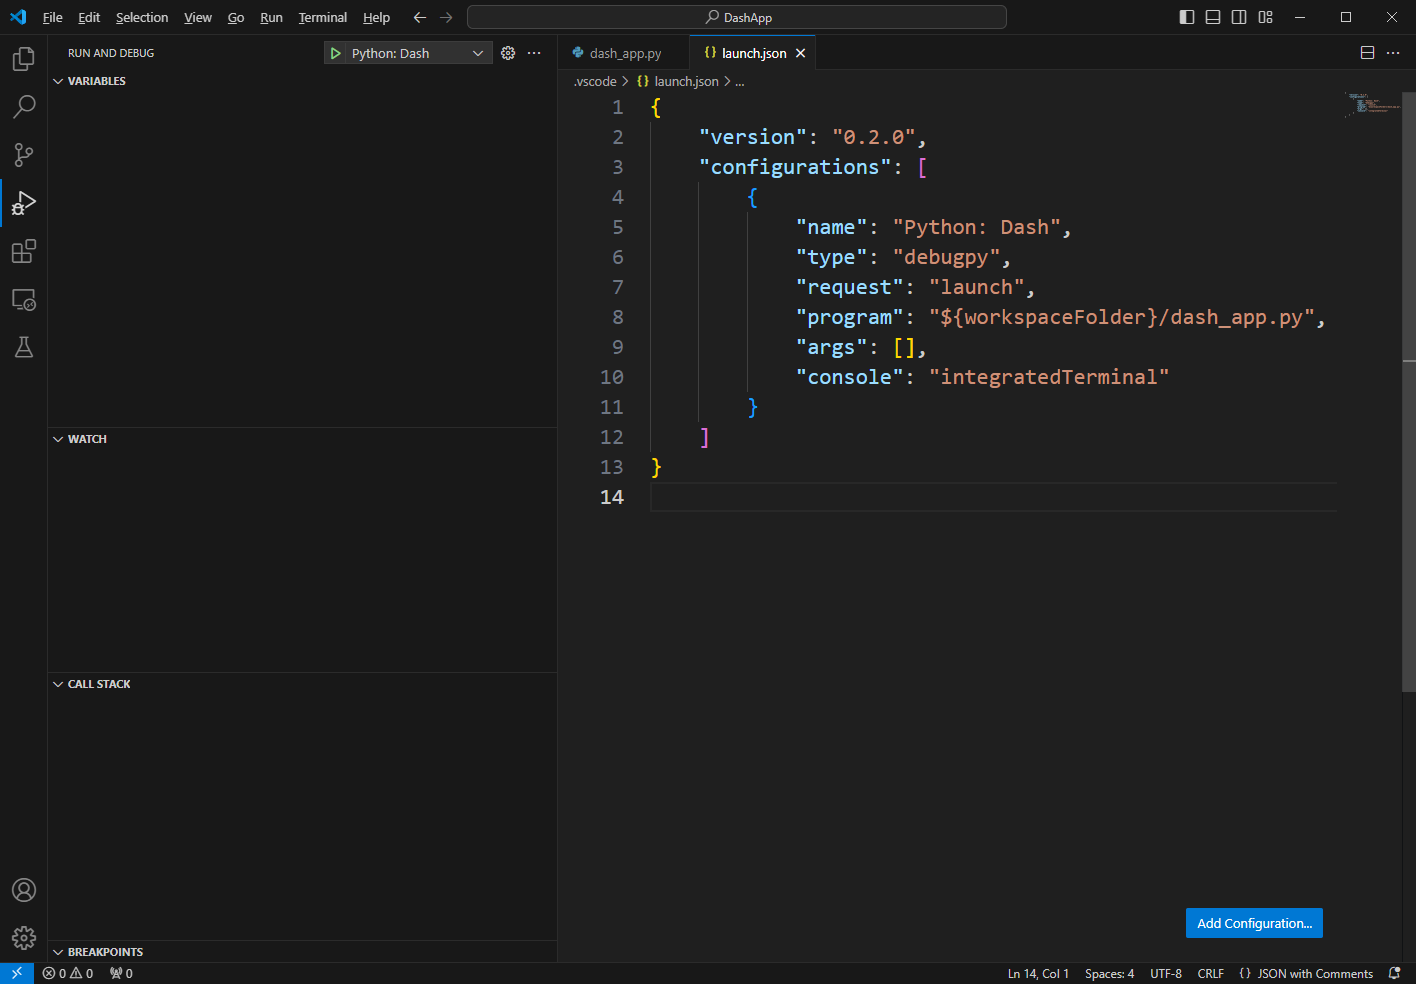
Now you have successfully configured the debugger.
When you open the dash_app.py file, you’ll see a new green play button that says: Python: Dash:
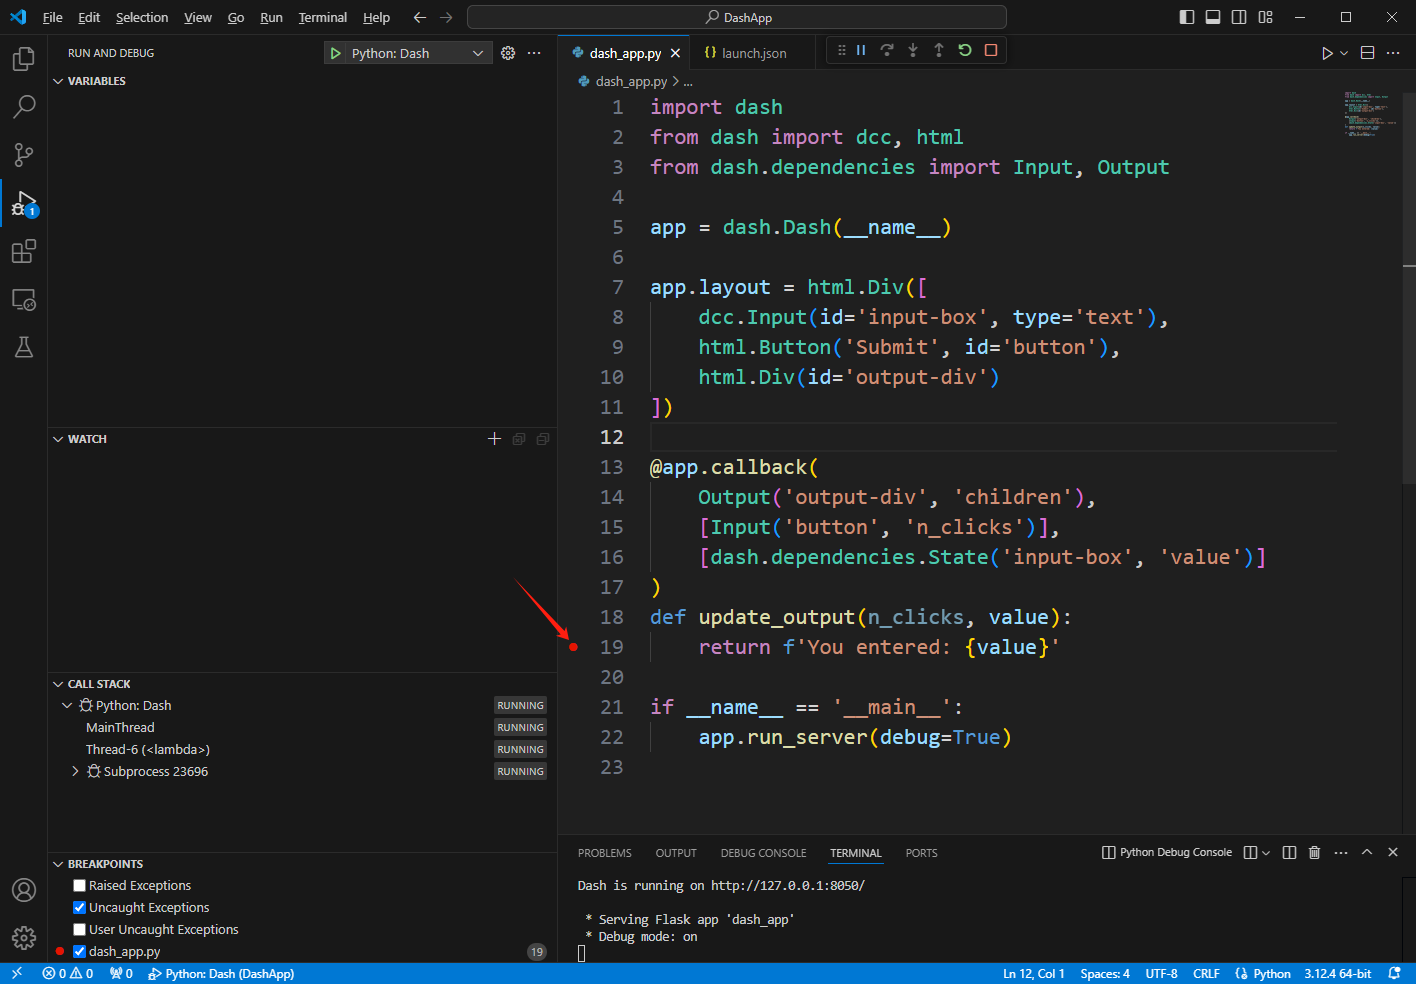
This means that the debugger has been successfully configured. Once you click on it, you’ll see that your app starts and the CALL STACK section on the left populates:

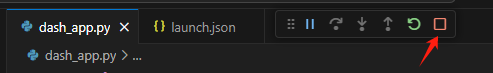
You’ll also see a new bar appear at the top. To exit the debugger, click on the red square:
Breakpoints are essential for pausing execution and inspecting your app’s behavior. When you set a breakpoint in a certain line (and such line runs), execution will halt, allowing you to explore the state of your application.
Here’s how to set a breakpoint:
Let’s use the example app dash_app.py. We’ll set a breakpoint in line 19, which executes when we click the button. This is how it’ll look like after setting the breakpoint:
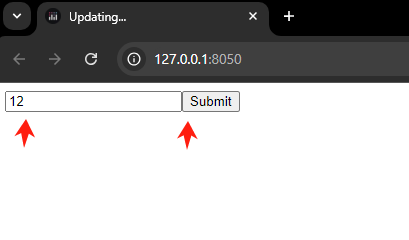
Now, go to the Dash app and submit an update:
Then, going back to VSCode, we can see that line 19 will have a yellow background:
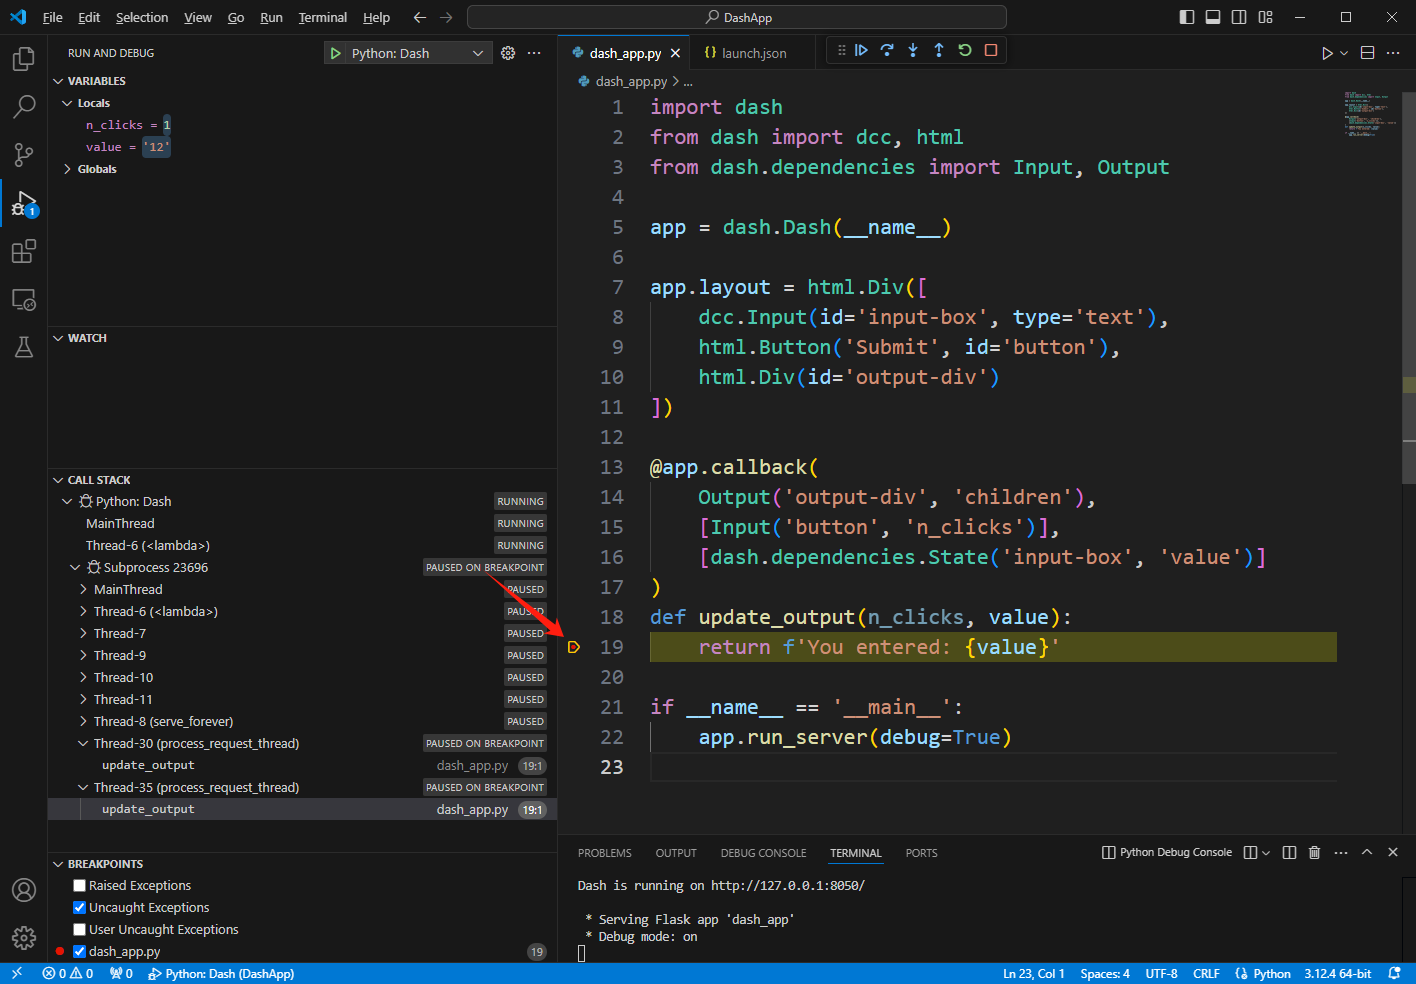
Furthermore, on your left side, we can see the values of the variables in your app:
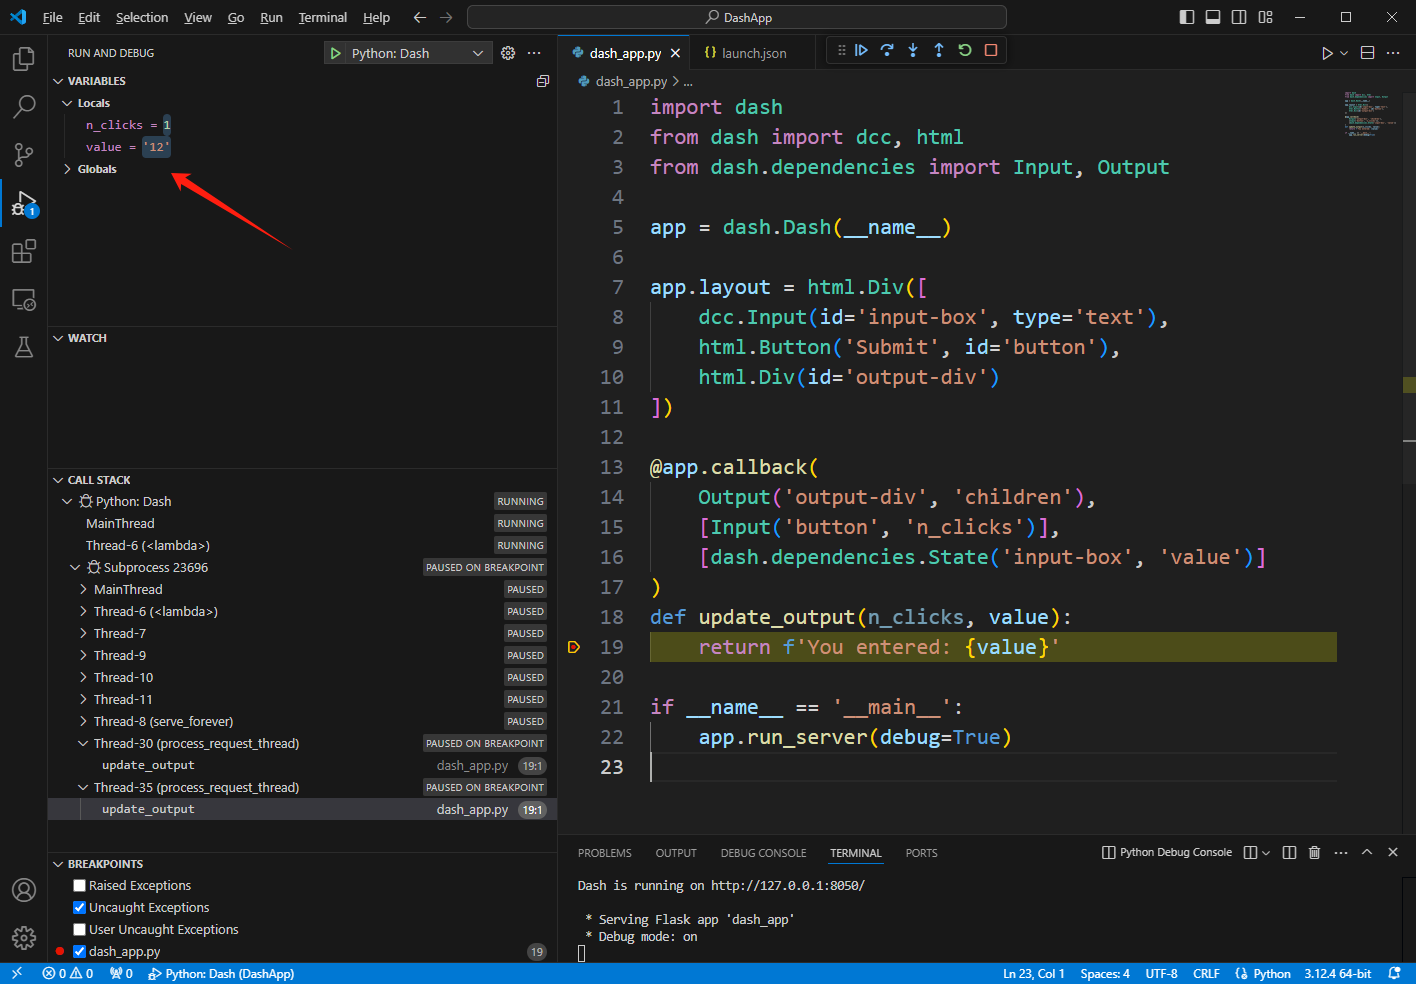
Execution has been stopped; now, you can debug your app. You can move to the DEBUG CONSOLE, which will allow you to explore the variables, set new values, and run Python code:
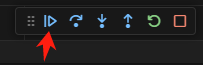
Once you’ve finished debugging, you can click on the first button in the top bar to continue execution:
Congratulations! Note that we’ve only scratched the surface of VSCode’s debugging features. So, experiment with it to learn more!
Once your app is ready, deploy it to our platform! We offer several features to help you build a professional Dash application: authentication, analytics, powerful CPUs, GPUs, secure API key storage, deployment from GitHub, custom domains, etc.
Seamless deployment for data scientists and developers. Ploomber handles infrastructure so you focus on building. Secure and scalable—from personal projects to enterprise apps. Support for Streamlit, Dash, Docker, and AI-powered applications. Because life's too short for deployment headaches.

