


Looking to host PyScript apps? Do it for free with Ploomber Platform!
PyScript is an open-source framework that enables users to run Python programs in the browser using HTML. It has been developed using the power of Pyodide, WASM and other modern web technologies. PyScript provides a flexible framework that Python developers, especially data scientists, can build on to create extensible components directly in Python.
Here are some benefits of using PyScript:
Python programmers can easily write standalone web applications using PyScript.
Statisticians or data scientists can generate shareable and clickable HTML files for viewing model predictions.
Users do not need to install Python or any other dependencies to interact with the dashboard. These are automatically installed when the script runs in the browser.
In this tutorial, we’ll learn how to visualise some data in Jupyter Notebook using matplotlib and then use an automation script to automatically convert this to a standalone interactive dashboard that uses PyScript.
You may download the HTML file using one of the below commands:
curl -O -L https://raw.githubusercontent.com/ploomber/posts/master/notebook-to-dashboard/dashboard.html
wget https://raw.githubusercontent.com/ploomber/posts/master/notebook-to-dashboard/dashboard.html
Here’s a preview of the interactive dashboard.
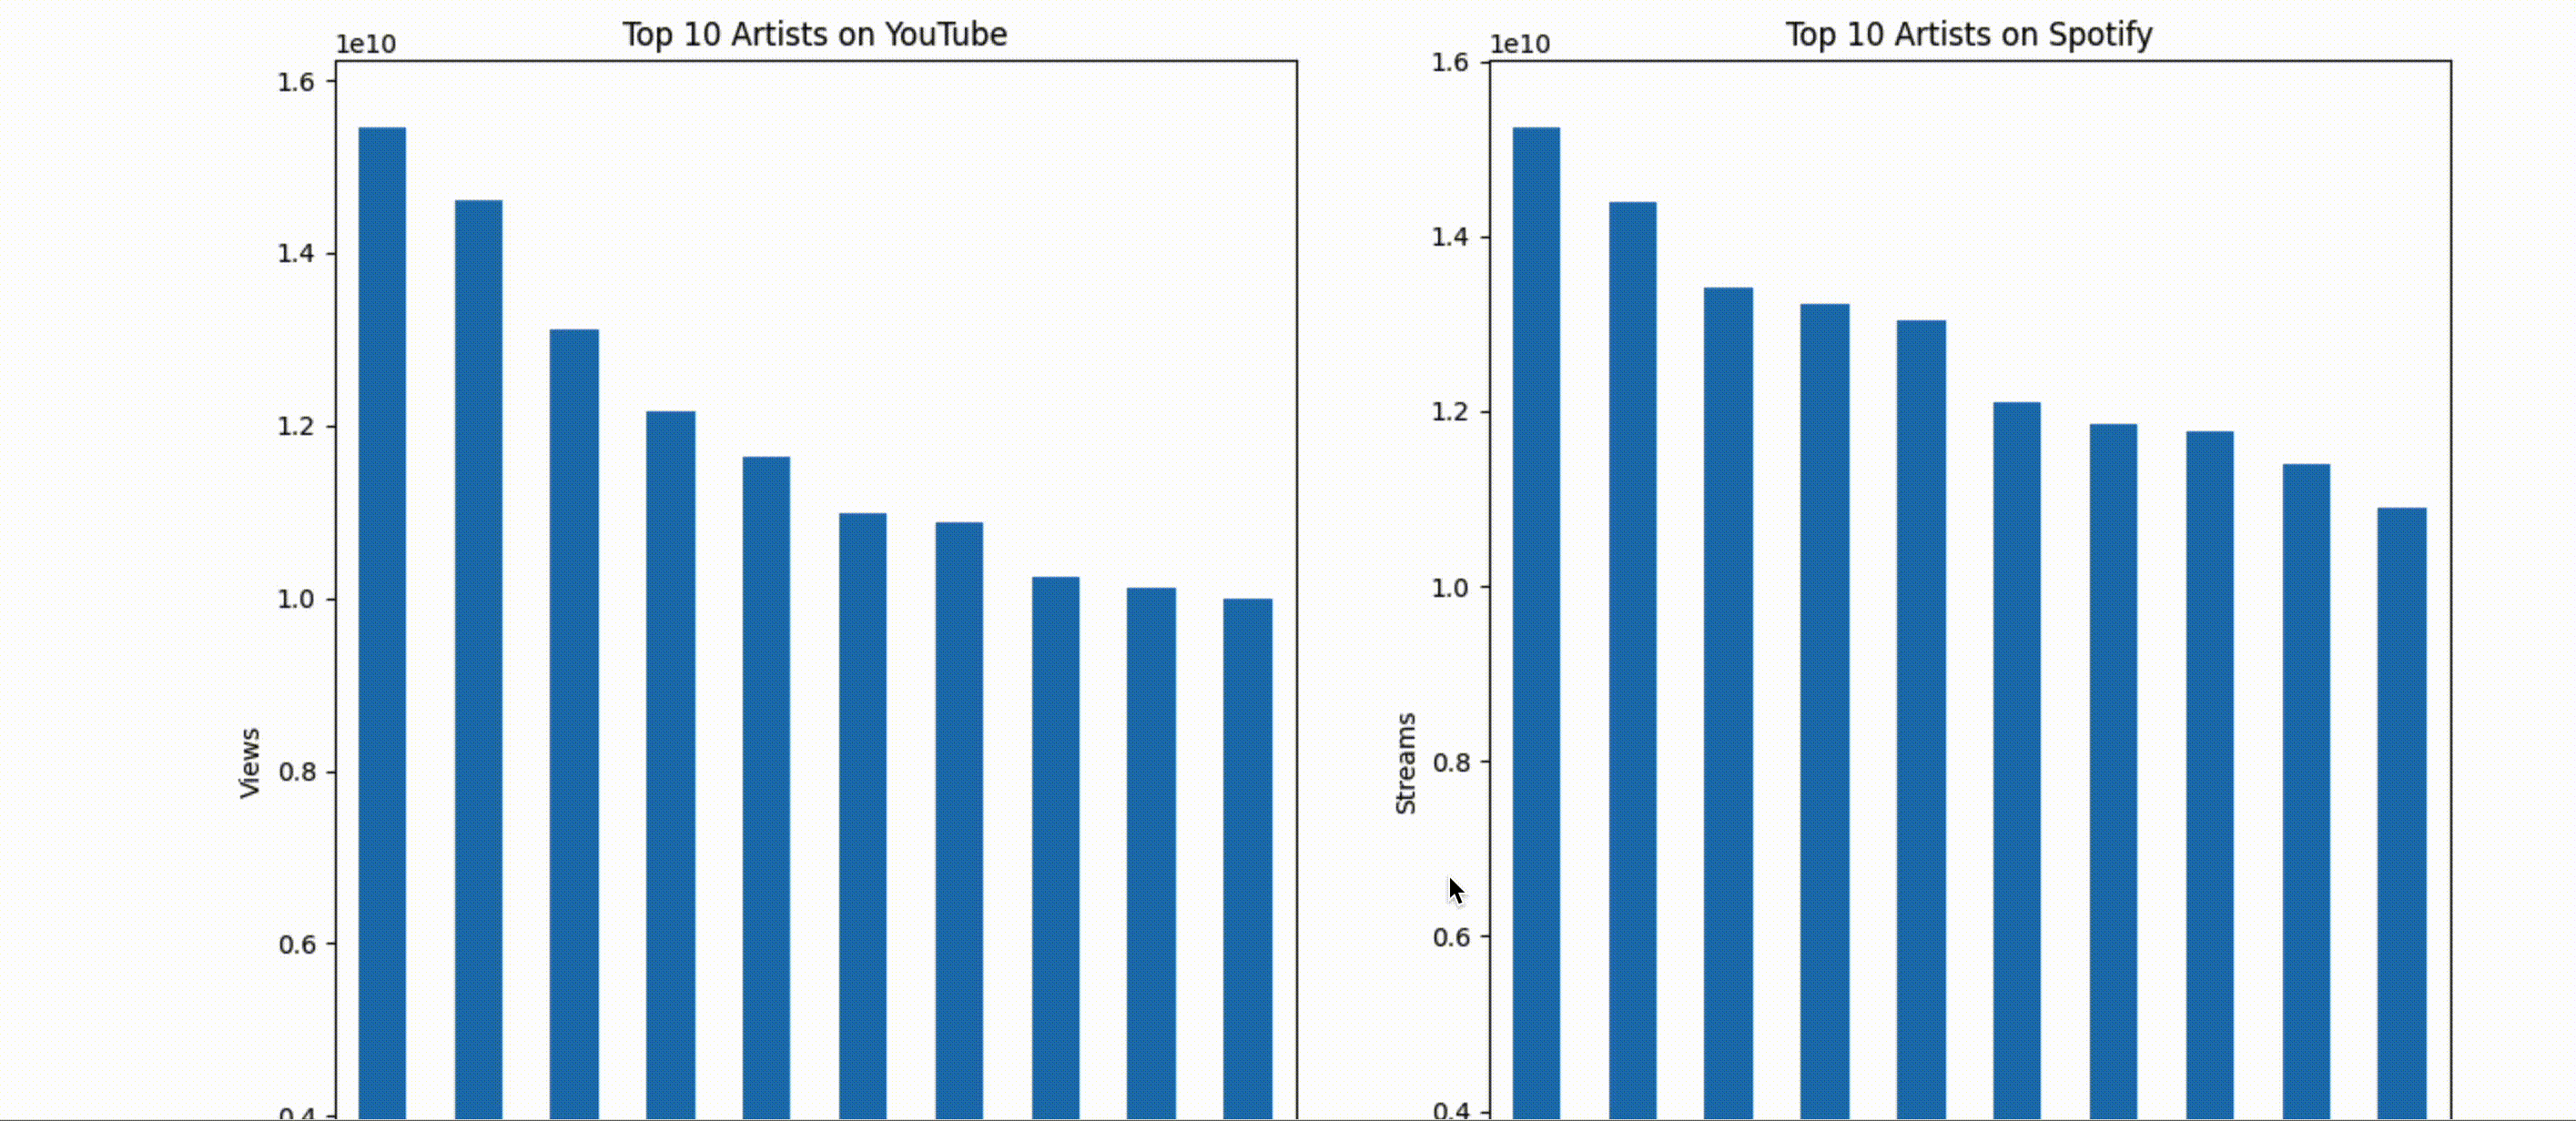
For this tutorial we’ll be using the YouTube and Spotify artists dataset and follow the below steps for the notebook to be ready to be consumed by the automation script:
Enable the Jupyter Notebook cell tag editor by clicking on View -> Cell Toolbar -> Tags. This will enable the tags UI. This is useful because the user needs to add a few important cell tags that are needed by the automation script.
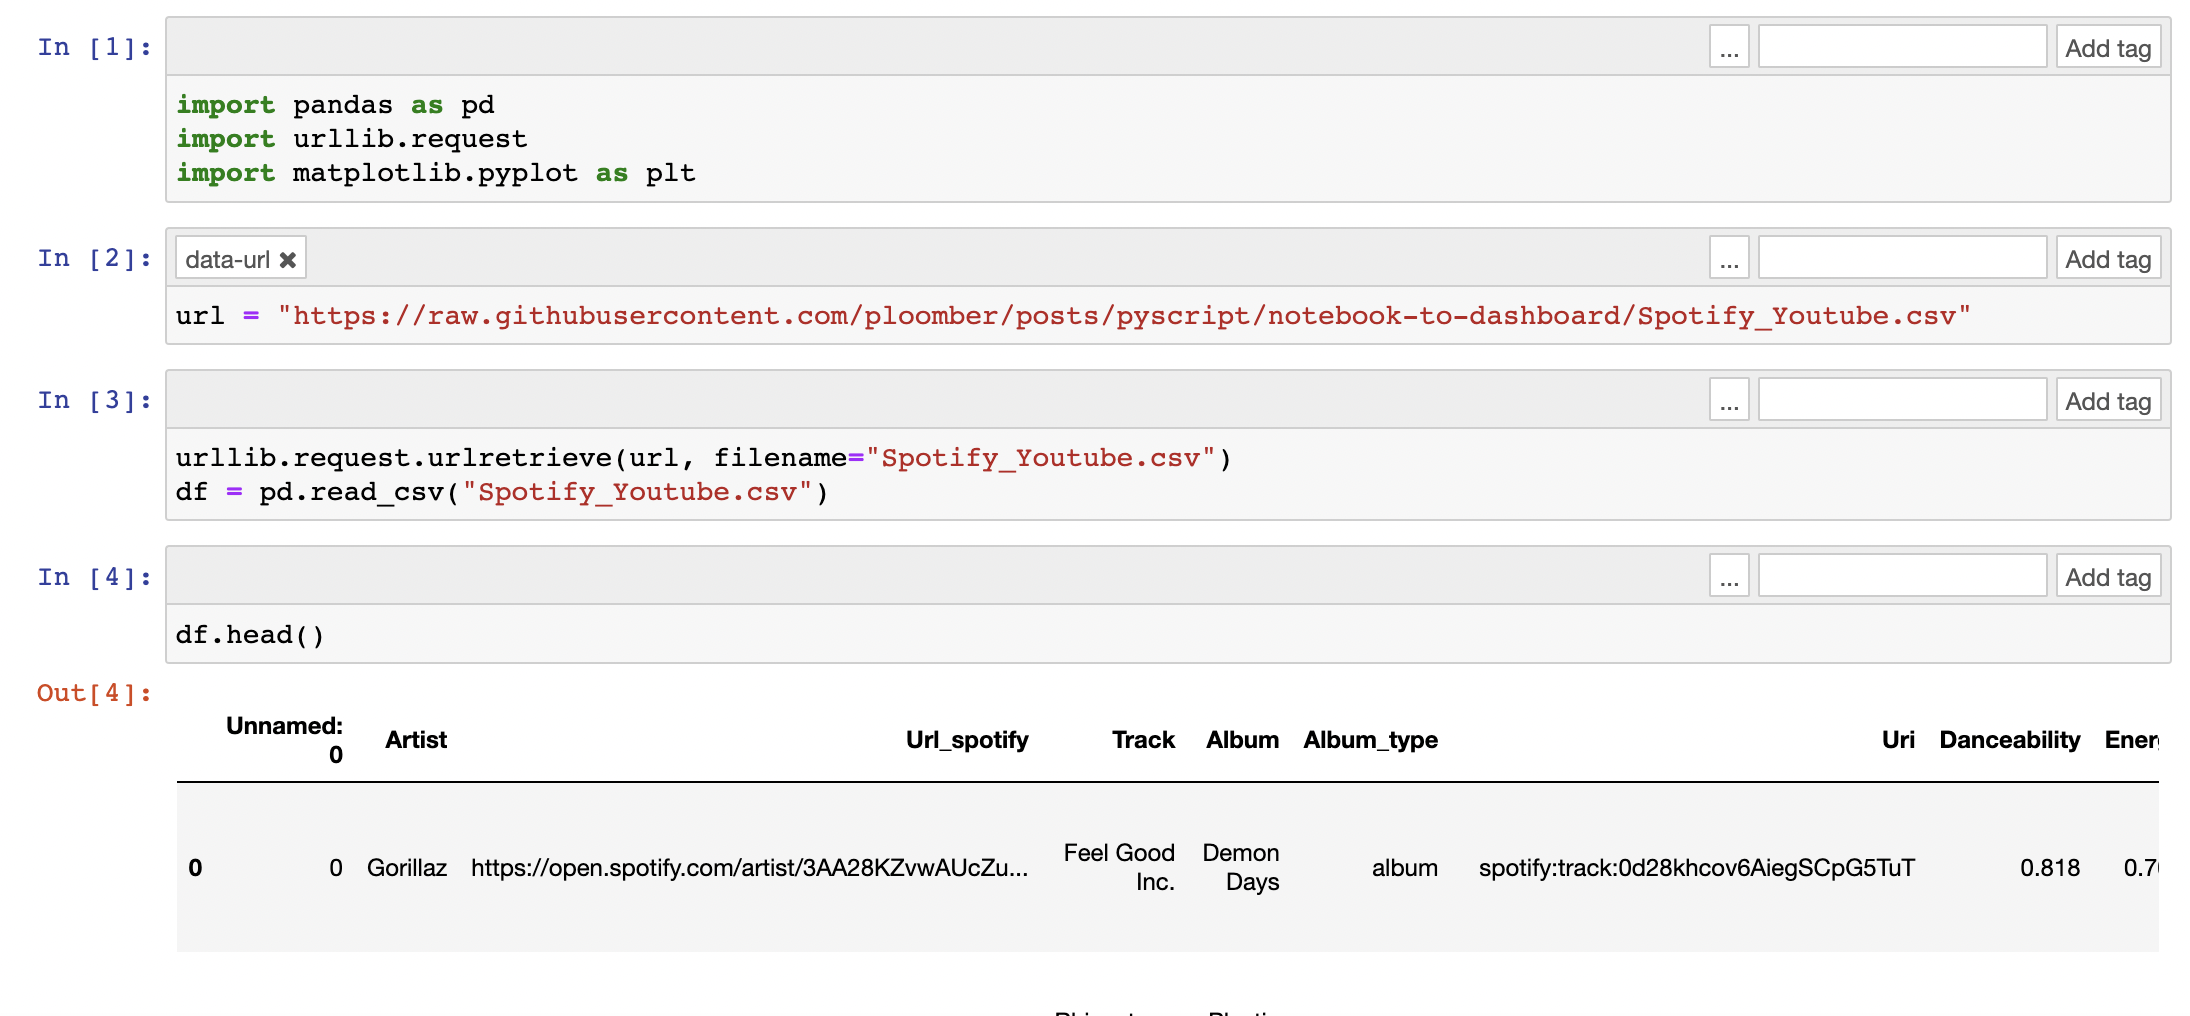
Read the data from the URL in which it is hosted. Note that PyScript uses Pyodide to access any data hosted on a server. Hence we need to add a special tag data-url to the cell that contains the URL of the dataset.
Analyse your dataset as needed.
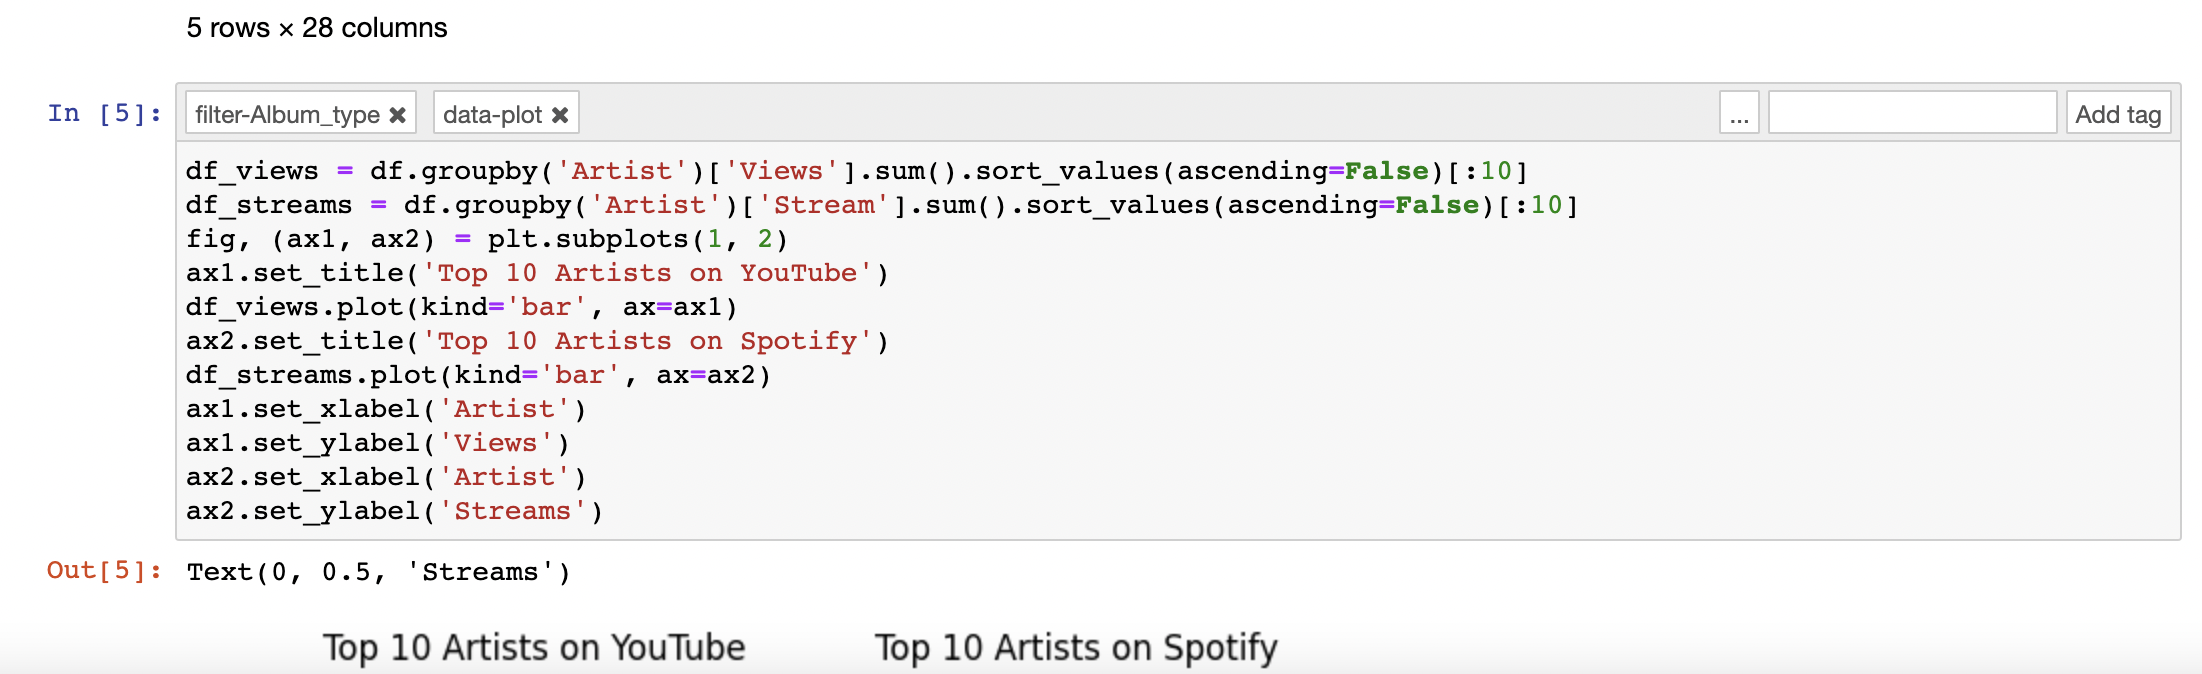
Plot the relevant details. Here we’ll be plotting the top 10 artists on YouTube and Spotify respectively. Ensure that the core plotting logic lies in one cell and add data-plot tag to this cell. This indicates the script that needs to run as part of PyScript. Also, add a tag filter-Album_type to this cell. This will enable interactivity on the column Album_type which has 3 unique values: album, single and compilation. You may replace this with any other suitable column.
Here’s the notebook for reference.
The automation script reads the notebook and converts the relevant contents into a PyScript file. Some important points regarding this script:
The script uses the nbformat package for reading the source and metadata tags of each cell in the notebook.
Important variables are extracted like url of the dataset, possible package imports, and the final code used for plotting the graph.
Based on filter tags added by the user the script extracts unique column values from the dataset.
Finally, these variables are substituted in a template string to generate the PyScript code.
You may download the script using one of the below commands:
curl -O -L https://raw.githubusercontent.com/ploomber/posts/master/notebook-to-dashboard/nb2dashboard.py
wget https://raw.githubusercontent.com/ploomber/posts/master/notebook-to-dashboard/nb2dashboard.py
Now, run the nb2dashboard.py file in the same directory as your notebook.
python nb2dashboard.py <notebook_name>.ipynb
This should generate a file named dashboard.html. Ensure that the packages mentioned in <py-config> are accurate. The indentation of the Python code in <py-script> may vary depending on the editor, especially the package imports and code appended in def plot(data). Such indentation errors can be fixed manually. Here are some guidelines for Sublime editor.
NOTE
In case of any issues in converting the notebook using this script, message us on Slack. and we’ll help you out.
Here is a reference PyScript file that you may use for verifying the generated file. The imported packages are defined in the <py-config> tag.
<py-config>
         packages = [ "pandas", "matplotlib" ]
</py-config>
All the Python code needs to be present within the <py-script> tag. The dataset is accessed using the Pyodide library.
from pyodide.http import open_url
from pyodide.ffi import create_proxy

url = "https://raw.githubusercontent.com/ploomber/posts/master/notebook-to-dashboard/Spotify_Youtube.csv"
df = pd.read_csv(open_url(url))
The select_filter function is used to select a subset of the dataset based on the column value interactively selected by the user. Interactivity has been enabled by a set of radio buttons, each of which corresponds to a unique value of the filter column as tagged by the user in the notebook.
<div id="input" style="margin: 20px;">
      Select Album_type : <br/>
      <input type="radio" id="all" name="Album_type" value="ALL">
      <label for="all"> All</label>
      <input type="radio" id="album" name="Album_type" value="album">
      <label for="album"> album </label>
      <input type="radio" id="single" name="Album_type" value="single">
      <label for="single"> single </label>
      <input type="radio" id="compilation" name="Album_type" value="compilation">
<label for="compilation"> compilation </label>
</div>
Seamless deployment for data scientists and developers. Ploomber handles infrastructure so you focus on building. Secure and scalable—from personal projects to enterprise apps. Support for Streamlit, Dash, Docker, and AI-powered applications. Because life's too short for deployment headaches.

