


A substantial amount of time in a data science project or creating data-based product is spent on getting the data ready for modeling. This process involves lots of data cleaning, manipulating, preprocessing operations.
Pandas is a data analysis and manipulation library for Python that expedites and simplifies these operations. It is one of the most popular tools in the data science ecosystem and usually the first one you meet when you start learning data science.
Pandas library has numerous functions and methods. In this article, we will go over tips and tricks that will help you make more use of Python by using some of these functions more efficiently.
![]()
groupby functionThis is one of the most frequently used Pandas functions for data analysis. We can calculate aggregate values based on the distinct values or categories in a column. Some typical examples of when to use the groupby function:
These are calculated using the mean, min, and max functions, which are some of the commonly used aggregate functions. There are many other aggregate functions that can be used with groupby. Some of them are not frequently used but come in handy for a variety of tasks.
For instance, we can find the maximum and minimum 2 values in a group using the nlargest and nsmallest functions, respectively. Let’s do an example. We asume to have a Pandas DataFrame with team, name, and score columns. Here are the first 5 rows of this DataFrame:
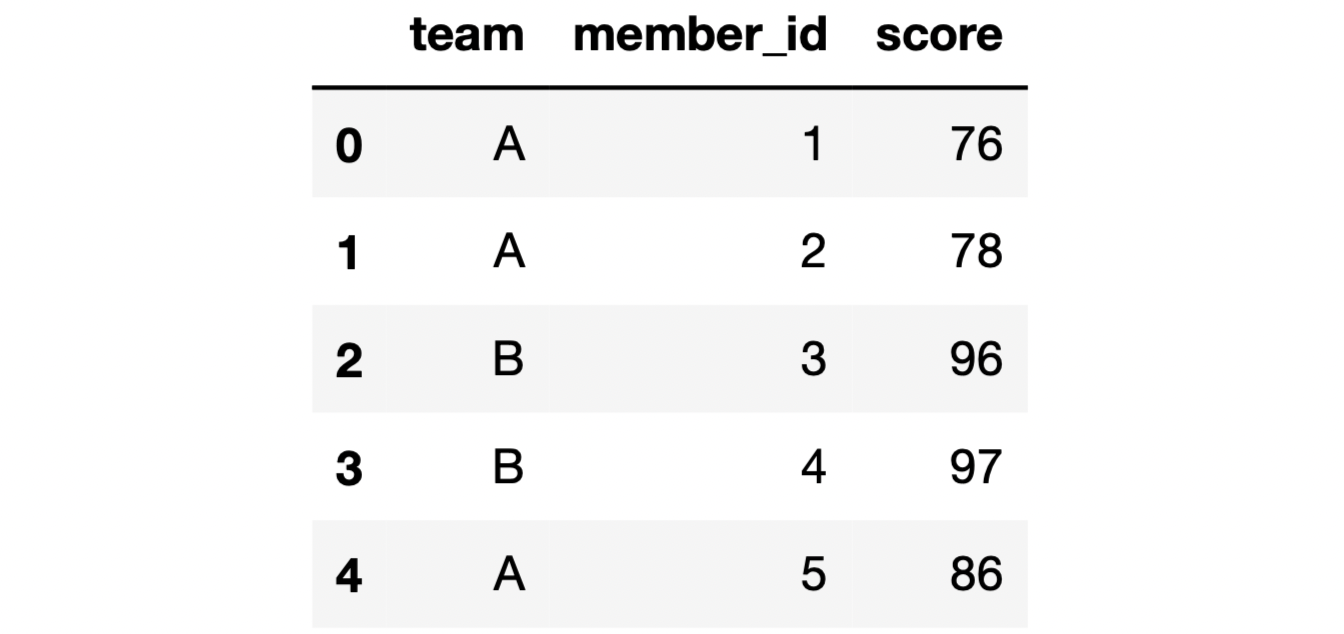
We can find the largest 2 scores for each group as follows:
df.groupby("team")["score"].nlargest(2)
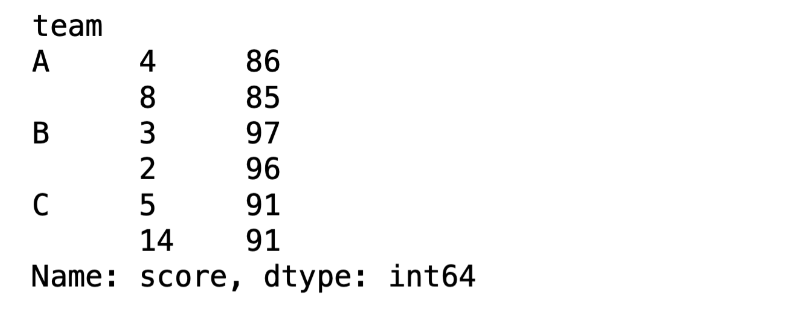
In addition to the value, we also get the index of its row so we can access the entire row if needed. The syntax for the nsmallest function is the same. We can obtain any number of the largest and smallest values by changing the parameter (e.g. nsmallest(3) for the smallest 3 values).
Consider a case where the values within each group are sorted and we want to find out the 3rd highest value in each group. We are not interested in the largest 3 values but only the 3rd largest one. We can find these values using the nth function.
df.groupby("team")["score"].nth(2)
The line of code above returns the 3rd row within each group. If the values are sorted in descending order within groups, we will get the 3rd largest values.nth(0) returns the first values, nth(1) returns the second ones, and so on.
We can use a dictionary with some functions to perform multiple operations in one step. For instance, the astype function is used for changing the datatype of a column. We can change the data types of as many columns as needed using a Python dictionary.
Here is an example:
df = df.astype({
    "col_a": "int64",
    "col_b": "datetime64[ns]",
    "col_c": "float64"
})
Each change is written as a key-value pair in the dictionary.
Another function that can be enhanced with a dictionary is replace, which is used for replacing values in a column. Let’s say we need to change the names in the team column. Here is how this operation can be done:
df["team"] = df["team"].replace({
    "A": "team_1",
    "B": "team_2",
    "C": "team_3"
})
The values A, B, and C are replaced by team_1, team_2, and team_3, respectively.
value_counts functionThis is a highly common function used in exploratory data analysis. It returns the unique values in a column along with their number of occurrences.
Here is an example of how it is used:
df["team"].value_counts()
Output:
A 8
B 6
C 5
Name: team, dtype: int64
If you are interested in the percent share of each distinct value or category, use the normalize parameter and set its value as True.
df["team"].value_counts(normalize=True)
Output:
A 0.421053
B 0.315789
C 0.263158
Name: team, dtype: float64
dropna parameterSome functions ignore the missing values by default. The groupby and the value_counts function we have just mentioned are examples of such functions. Thus, their output does not contain the missing values, which might be misleading in some cases.
Consider we have a DataFrame with 1 million rows and 20 percent of values in a categorical column are missing. If we use the value_counts function to check the distribution of the values and ignore the missing values, the results will not reflect the distribution accurately.
I created a DataFrame with some missing values in the city column. Let’s apply the value_counts function with and without the dropna parameter.
df["city"].value_counts(normalize=True)
Output:
Houston 0.454545
Rome 0.318182
London 0.227273
Name: city, dtype: float64
df["city"].value_counts(normalize=True, dropna=False)
Output:
Houston 0.370370
Rome 0.259259
London 0.185185
NaN 0.185185
Name: city, dtype: float64
We can observe the impact of the missing values as the results are very different.
The missing values are ignored by the groupby function as well. We can change its behavior by setting the value of the dropna parameter as False.
The integer data type does not support missing values. Therefore, if there is a missing value in a column with integers, they are automatically upcasted to float. If it is important for you to represent these values as integers, you can use the nullable integer data type.
Let’s do an example to demonstrate this case. We have a DataFrame as follows:
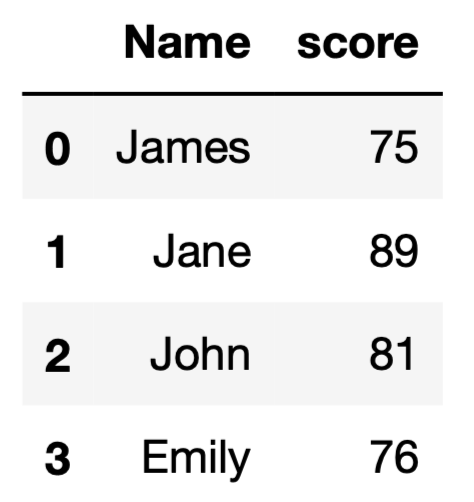
If we add a new row with a missing score value, the data type of the score column will become float.
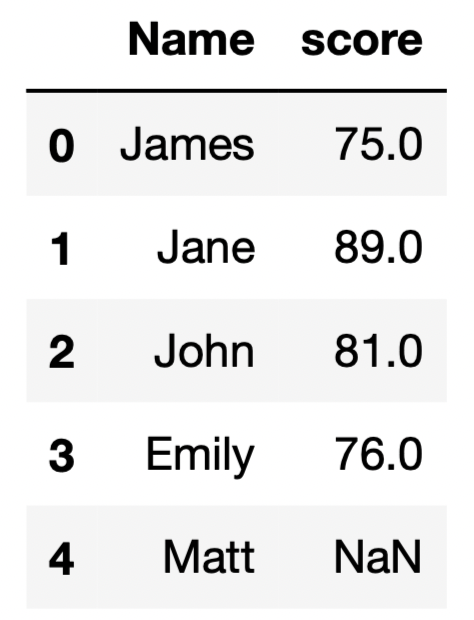
We can use the Int64Dtype() data type, which prevents the score column from being upcasted to float.
df["score"] = df["score"].astype(pd.Int64Dtype())
Here is how the DataFrame looks now:
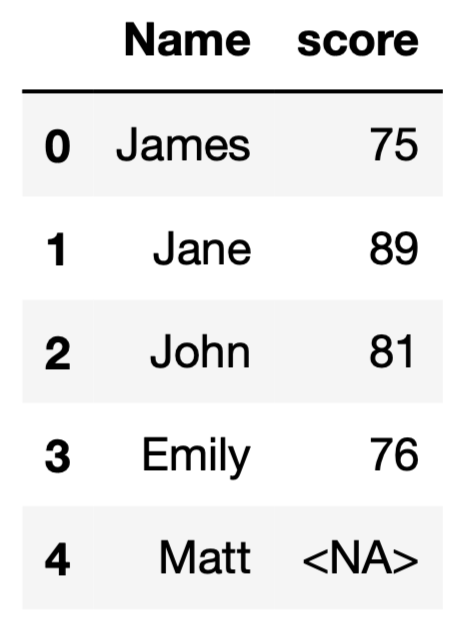
Data cleaning and manipulation is an essential part of any data-oriented product. Pandas provides several functions and methods to expedite and simplify the data processing workflows. In order to make the most out of Pandas, we should take one step further than the default settings in some cases.
If you want to learn more about Pandas and other resources for data science, join our community: http://ploomber.io/community 👈
Seamless deployment for data scientists and developers. Ploomber handles infrastructure so you focus on building. Secure and scalable—from personal projects to enterprise apps. Support for Streamlit, Dash, Docker, and AI-powered applications. Because life's too short for deployment headaches.

