


Panel is an open-source Python library designed to make creating robust, interactive, and complex data applications entirely in Python. It is part of the HoloViz ecosystem which is a collection of high-level tools to make plotting easier in Python.
Relational databases like PostgreSQL are often used to store and manage data efficiently. Integrating a relational database with your Panel applications offers several advantage. Since most data is stored in databases, directly fetching and visualizing data from the database—rather than exporting individual dataframes—is a more efficient and convenient approach. This process also ensures that your app uses the most up-to-date information. Additionally, you can enhance interactivity by parameterizing SQL queries with user inputs, allowing for dynamic data exploration.
In this blog post, we will be creating a Panel App for exploratory data analysis (EDA) using the Wine Quality dataset that we uploaded to a PostgreSQL database. If you would like to use a different database such as MySQL or SQLite, the process will be the same, apart from some minor differences that I will mention. We will showcase how to create a database, upload data, create a Panel app, interact with the database from the app, and deploy our app to Ploomber Cloud.
Let’s get started!
If you already have a database set up, feel free to skip this step. If you want to or are currently using a different database such as MySQL or SQLite, all the steps are identical aside from a few differences. All we have to do is replace our PostgreSQL URI’s with the URI’s corresponding to the other database. Check out this page for more details.
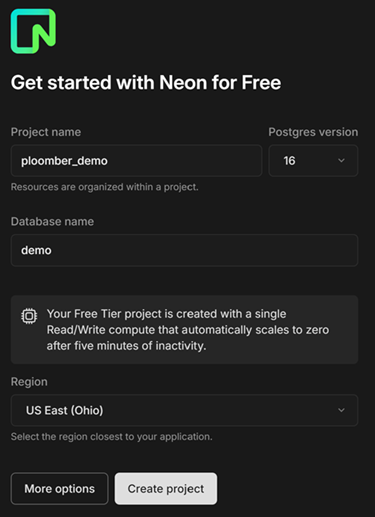
For the purpose of this blog, we can create a PostgreSQL database using Neon. Neon is a serverless Postgres database platform that allows developers to create a database in just a few clicks. A free tier with 0.5 GB of storage is available. After creating an account, you should be prompted to create a project. Enter the project name, the Postgres version you want, the database name, and your region.
After creating the project, you will be redirected to your project dashboard. Inside the dashboard, there is an element labeled Connection string. The connection string, also known as a URI, is an identifier that contains all the parameters required to connect to your database. We will need the URI later.
Before we start making our Panel app, let’s take a moment to examine the dataset we’ll be working with. The Wine Quality dataset contains data on the Portuguese “Vinho Verde” wine, with features related to its physicochemical properties such as pH level, acidity, and alcohol content. The dataset includes two variants of wine defined by its color - red and white, which we will be basing our app around.
Using this dataset, we will be creating an interactive EDA and visualization app. The app will feature a scatterplot, histogram, and various widgets to customize what gets plotted. Notably, we will have a widget to select available tables in our database, which is particularly useful if we have a database with several tables. To demonstrate how SQL queries can be dynamically modified based on user input, we’ll include a widget that limits the number of rows of data plotted. This can be useful if we have a really large dataset as it allows us to visualize a manageable subset of the data. While these are relatively basic functions, the approach we’ll demonstrate allows for extensive customization to fit your specific needs.
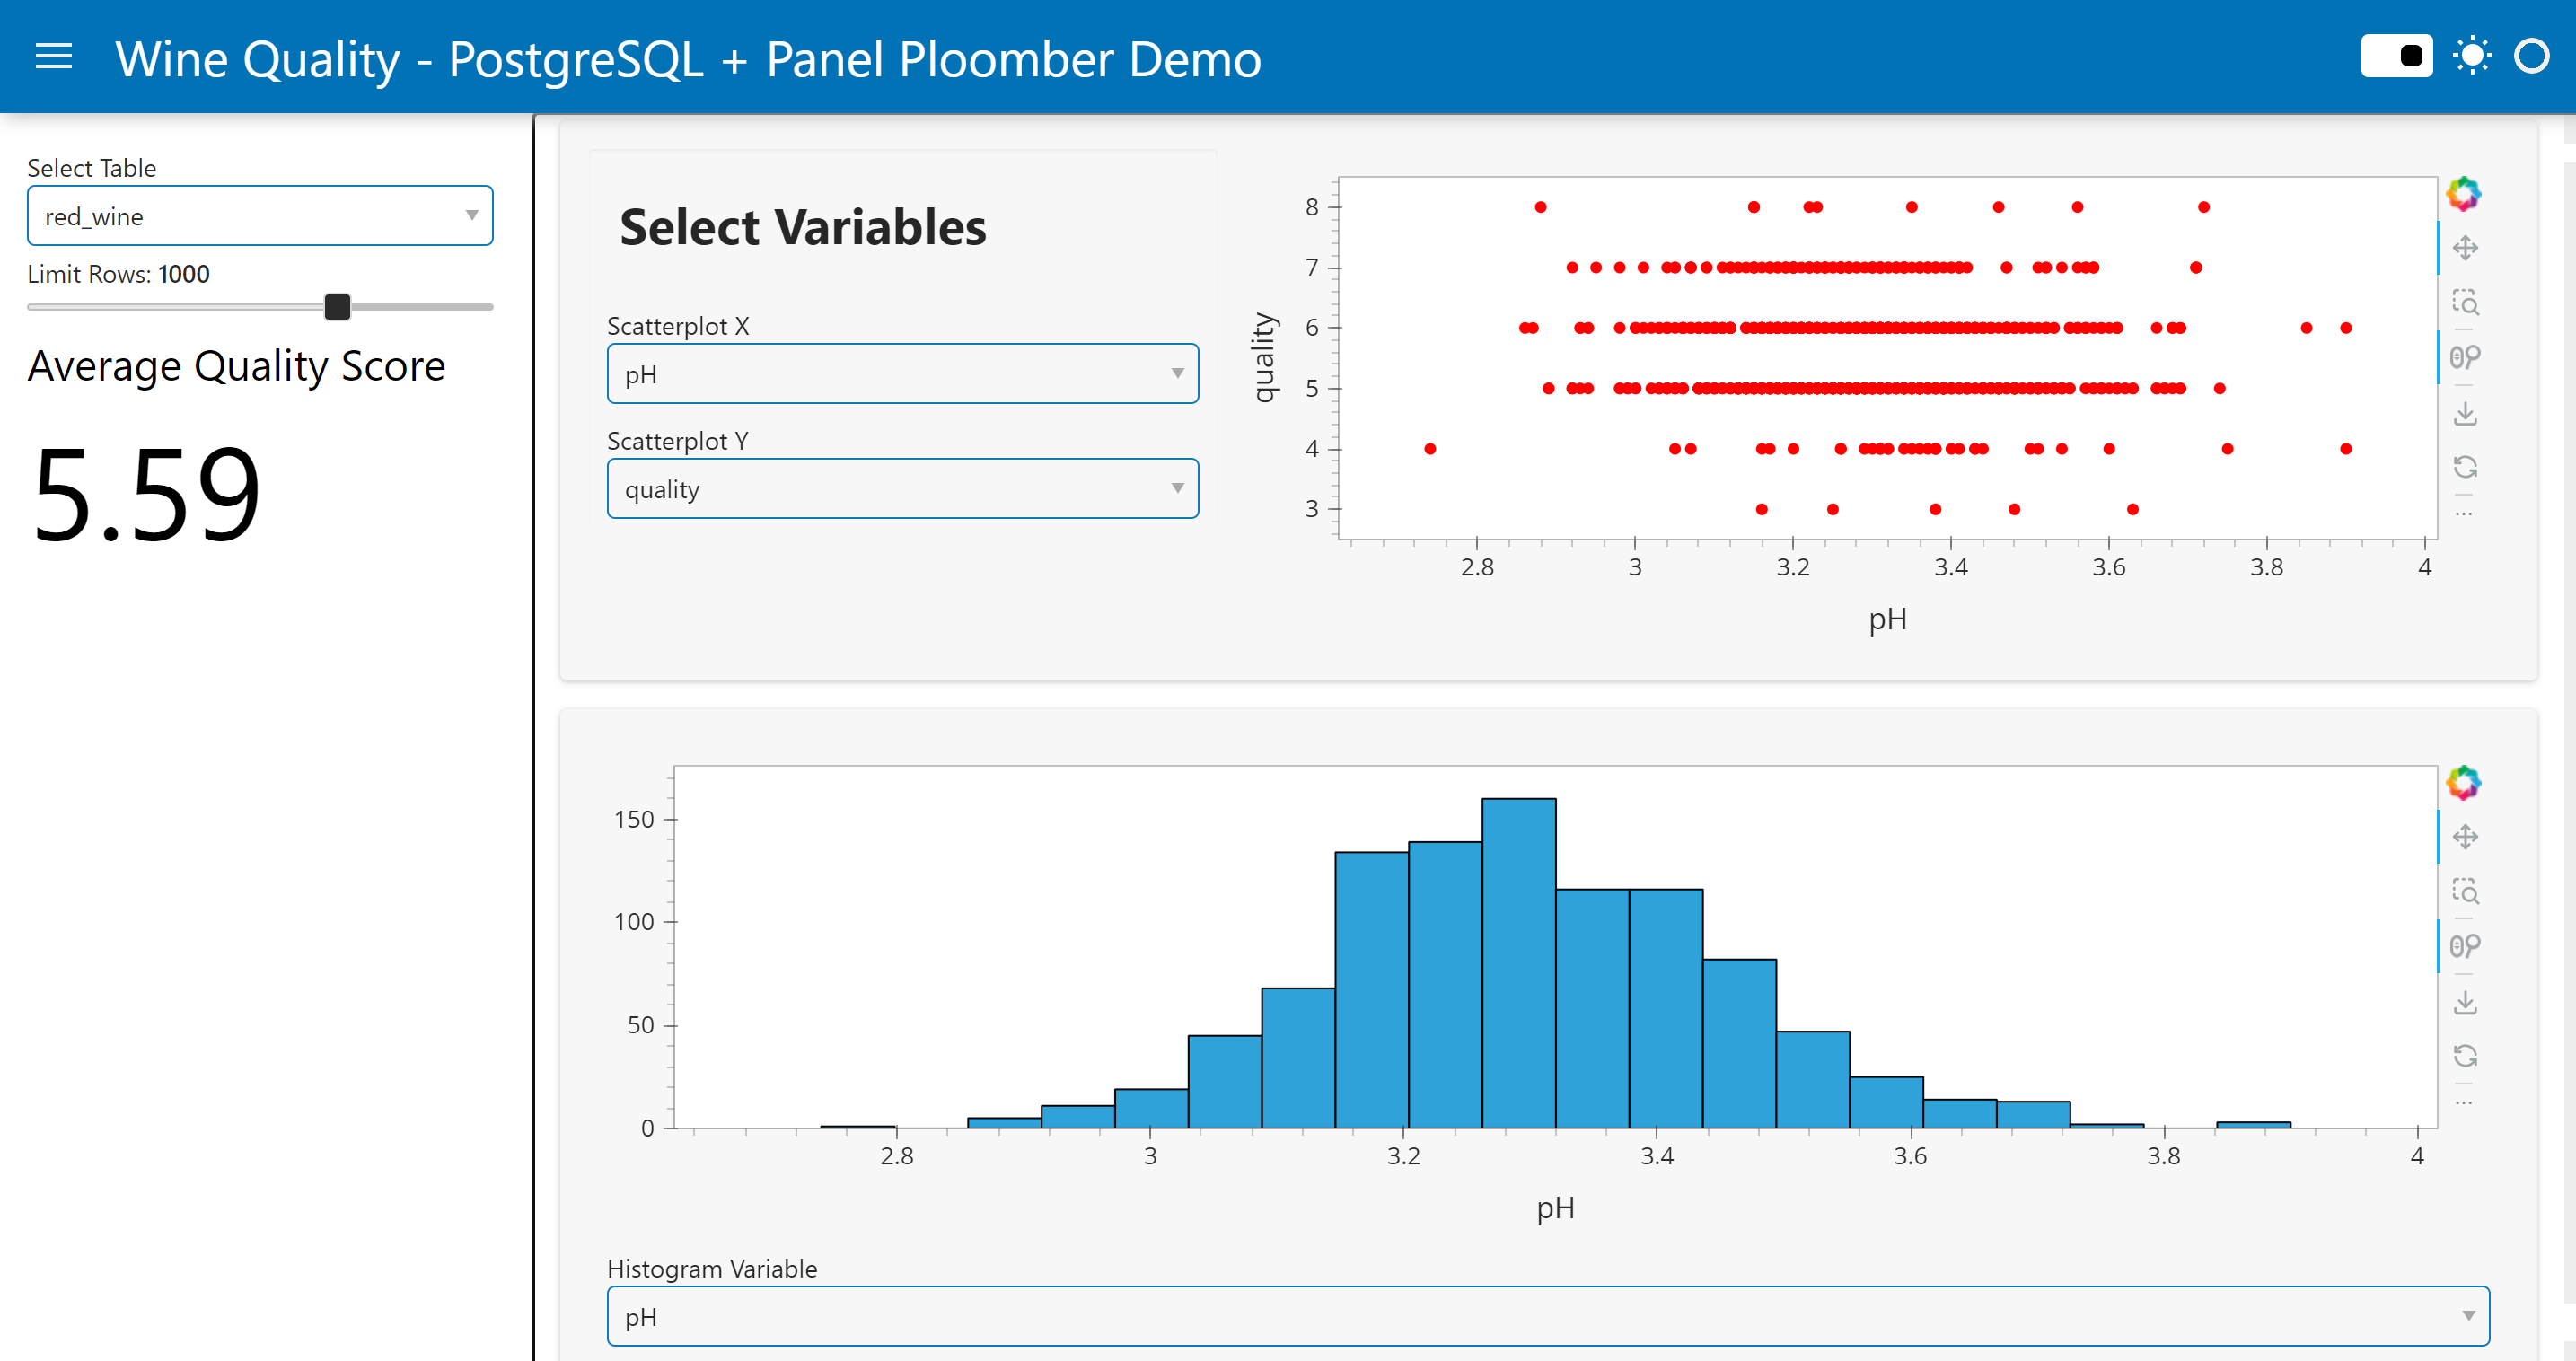
A preview of the app is shown below:
Let’s first install all the Python libraries that we’ll need for this Panel app. To do this, create a text file called requirements.txt. This file will contain all the libraries that are used in this app. Add the following to your text file:
pandas
numpy
panel
holoviews
hvplot
sqlalchemy
watchfiles
ucimlrepo
psycopg2-binary
To install these packages, we can run pip install -r requirements.txt in our command line.
After installing the packages, create a Python script, call it app.py. All of the code that we use to build the app will be in here.
In our script, we will import the packages that we just installed, as well as the os.environ object which is used for deployment.
import numpy as np
import pandas as pd
import panel as pn
import holoviews as hv
import hvplot.pandas
from sqlalchemy import text, create_engine, MetaData
from os import environ
from ucimlrepo import fetch_ucirepo
Next, let’s define a function called upload_data which takes in a sqlalchemy engine object, downloads the wine quality data, and uploads it to our database. To fetch the dataset, we are using the ucimlrepo package associated with the UC Irvine ML Repo. After reading in our data, we define two separate dataframes corresponding to red and white wines. We can make a connection to the database using the engine.connect method. Using this connection, we use the Pandas to_sql method to upload our dataframe as a table on our database.
def upload_data(engine):
    # Loading in wine dataset
    wine = fetch_ucirepo(name="Wine Quality")
    wine_df = wine.data.original
    wine_df.reset_index(drop=True)

    red = wine_df[wine_df["color"] == "red"]
    white = wine_df[wine_df["color"] == "white"]

    with engine.connect() as engine_conn:
        red.to_sql(name="red_wine", con=engine_conn, if_exists='replace', index=False)
        white.to_sql(name="white_wine", con=engine_conn, if_exists='replace', index=False)
        print("Data successfully uploaded.")
    engine.dispose()
Now, we just need to retrieve our database connection string (URI), create an engine object using the URI, and call our function. But because we don’t want to call upload_data every time we run our Panel app, let’s add some logic so that we only execute it if our data is not already in the database. We can obtain a list of tables in our database by using the sqlalchemy MetaData object which contains information about the structure of our database. In the following, we created a MetaData object bound to our engine, retrieved the table names, and added a conditional to check if the tables already exist in our database.
DB_URI = "YOUR_URI"
engine = create_engine(DB_URI, pool_pre_ping=True)

metadata = MetaData()
metadata.reflect(bind=engine)
table_names = [table.name for table in metadata.tables.values()]

if ("red_wine" not in table_names) or ("white_wine" not in table_names):
    upload_data(DB_URI, engine)
Now, run app.py and the data should appear in your database.
There are numerous ways to customize and build a Panel application. At a high level, a Panel app is composed of a layout that defines the structure and arrangement of the user interface. Within this layout, various components—such as text, widgets, plots, and other data elements—are placed to create an interactive user experience. Refer to the documentation to see all the options we have.
For this application, we will use the FastListTemplate which has a sidebar component and a main area for your plots. Add the following to the bottom of your app.py file and keep it at the bottom. We will be creating and adding components to our template.
template = pn.template.FastListTemplate(title="Enter your Title", main=[],sidebar=[], sidebar_width=280)
template.servable()
At the top of your script, after the package imports, add the following. This makes it so that your panel components take up the full width of the container they are in.
pn.extension(sizing_mode="stretch_width")
In your command line, now run panel serve app.py --autoreload. Open the http://localhost:PORT/app link in your browser and you should now see a blank Panel app. It’s now time to add some components!
Retrieving Data
Since our data is in the database, we need some way to retrieve it. We can do this by creating a get_data function similar to our upload_data function. However, unlike upload_data, we want to modify the results of get_data based on user inputs. To do this, we will need to use the pn.bind() function which allows us to bind interactive widgets to data or other components.
Let’s first create a selector widget called table, representing the table in our database that we want to visualize in our app. To make our widget, we need a list of options that the selector can choose from. In this case, our options are all the tables in our database and we happened to define a variable called table_names in the previous section that contains all table names.
table = pn.widgets.Select(name='Select Table', options=table_names)
Let’s create another widget, this time an integer slider representing the number of data rows we want visualize in our application. The syntax is similar but now we have to specify a start and end value.
limit = pn.widgets.IntSlider(name='Limit Rows (If 0, shows all)', start=0, end=1500)
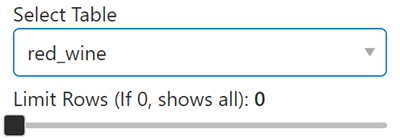
You should be able to add the table and limit widgets to the sidebar component of our template variable and because we’ve enabled autoreload, your webpage should update automatically. Here are what the widgets should look like on your app.
Now that we have these widgets, how do we actually use them? Well, we can define our get_data function to take in an engine, table, and limit parameter. In the function, we make a connection to our database and use pandas.read_sql to query from our database. In our SQL query, we modify the parameters with our widget inputs. In this case, we dynamically modify the table and row limit in our query. After querying the data, we return the corresponding dataframe.
def get_data(engine, table, limit):
    with engine.connect() as conn:
        # Show all data if limit is 0
        if limit == 0:
            wine_data = pd.read_sql(sql=f"SELECT * FROM {table}", con=conn)
        else:
            wine_data = pd.read_sql(sql=f"SELECT * FROM {table} LIMIT {limit}", con=conn)
    conn.close()
    return wine_data
To actually make our data update each time we interact with our widget, we use the aforementioned pn.bind method. What this function call does is that every time the engine, table, or limit values change, it calls the get_data function using those parameters and assigns the result to our wine_data variable.
wine_data = pn.bind(get_data, engine=engine, table=table, limit=limit)
Now, every time we interact with the limit or table widgets, our data updates with it. Kind of cool right?
Creating a Scatterplot
Now that we can retrieve our data, we can start making visualizations. The first data feature we will make is an interactive scatterplot, where users can select what variables they want to plot. Before we do that, we have to make sure that we only plot numerical features. To do this, we can define a function called getQuantVars that takes in a dataframe and returns a list of all numerical columns in the dataframe. Then, we can use pn.bind to bind this function to our wine_data variable, which means it will run every time our wine data changes.
def getQuantVars(wine_data):
    return wine_data.select_dtypes('number').columns.to_list()

quant_vars = pn.bind(getQuantVars, wine_data=wine_data)
Again, since our dataset is changing, we need to have our scatterplot dynamically update each time we change our wine_data variable. To do this, we’ll define a function that creates the scatterplot and bind it to the wine_data variable. Our function will take in a dataframe and the x and y variables. To make the scatterplot, we can use the hvplot method which creates interactive apps from a Pandas dataframe. For more information on hvplot, check out the documentation here.
def plotScatter(wine_data, x, y):
    scatter = wine_data.hvplot.points(
        x,
        y,
        color=wine_data["color"].replace({"white":"black"}),
        responsive=True,
        min_height=270,
    )
    return scatter
To let the user select the variables they want to graph, we will create selector widgets for the x and y variables using our list of numeric variables we defined earlier. By binding the plotScatter function to our wine_data, scatter_x and scatter_y variables, we generate a new scatterplot each time the data or x and y variables change.
scatter_x = pn.widgets.Select(name = "Scatterplot X", options=quant_vars)
scatter_y = pn.widgets.Select(name = "Scatterplot Y", options=quant_vars)

scatter = pn.bind(plotScatter, wine_data=wine_data, x=scatter_x, y=scatter_y)
To improve the layout, we will put the widgets we just made into a widgetbox, and place the widgetbox and scatterbox into a column layout.
scatterWidget = pn.WidgetBox('# Select Variables', scatter_x, scatter_y, max_width=350)

row1= pn.Column(pn.Row(scatterWidget, scatter, sizing_mode="stretch_both"))
Once you add this to our FastListTemplate, you should be able to see the widgets and scatterplot.
Creating a Histogram
We will follow a similar process for making our histogram. First, we can define a function which takes in a dataframe and variable name and returns a histogram.
def plotHist(wine_data, hist_var):
    hist = wine_data.hvplot.hist(
        hist_var,
        min_height=270,
        responsive=True
    )
    return hist
Next, we create a widget to let the user select the numerical variable they want to plot on their histogram. We use pn.bind to bind the plotHist function to our wine_data and widget. Lastly, we place the widget and histogram into another column layout.
hist_var = pn.widgets.Select(name = "Histogram Variable", options=quant_vars)

hist = pn.bind(plotHist, wine_data=wine_data, hist_var=hist_var)

row2= pn.Column(hist, hist_var, sizing_mode="stretch_both")
Adding other Components
Panel offers a variety of components that we can make and place on our application. To see everything Panel has to offer, check out this page.
This time, let’s create a number indicator which shows the average quality score of the wines in our dataset. Again, we see a similar pattern; we define a function to create this component and bind it to our wine_data and any other parameters we need.
def getAvg(wine_data, var):
    avg = wine_data[var].mean()
    return pn.indicators.Number(name = "Average Quality Score", value=round(avg, 2))

qualityScore = pn.bind(getAvg, wine_data=wine_data, var="quality")
Running the App
After following the steps above, your template should now look like this:
template = pn.template.FastListTemplate(title="Wine Quality - PostgreSQL + Panel Ploomber Demo", main= [row1, row2],sidebar=[table, limit, qualityScore], sidebar_width=280)

template.servable()
If you haven’t executed panel serve app.py --autoreload in your command line yet, you can do so to run the app locally.
Congratulations! You have now created a Panel app that interacts with your PostgreSQL database.
After all your hard work building the Panel app, you can share it by deploying it on Ploomber Cloud! You just need to create a Ploomber Cloud account and prepare the following files, which you should have ready already.
app.py which contains your Panel applicationrequirements.txt which contains all Python packages used in your app.Now, create a zipped folder containing these files. You can do this via the command line by navigating to your project folder and executing: zip app.zip app.py requirements.txt.
But before we do this, we want to remove the Database URI from our code so that we avoid exposing our URI. Instead, we can use the Secrets feature and store our database URI as an environment variable. If you are following the demo code, we just need to change DB_URI = "YOUR_DB_URI to the following:
DB_URI = environ["DB_URI"]
Now, log into your Ploomber Cloud account and you should be redirected to the cloud applications user interface. Optionally, you can also use the Ploomber Cloud command line interface (CLI) to deploy the app if you prefer. Click here for more information.
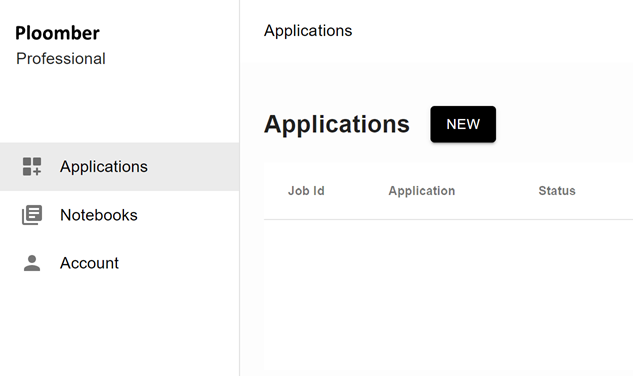
Click on New. If you are a pro user, you can give the application a custom name under the Overview section.
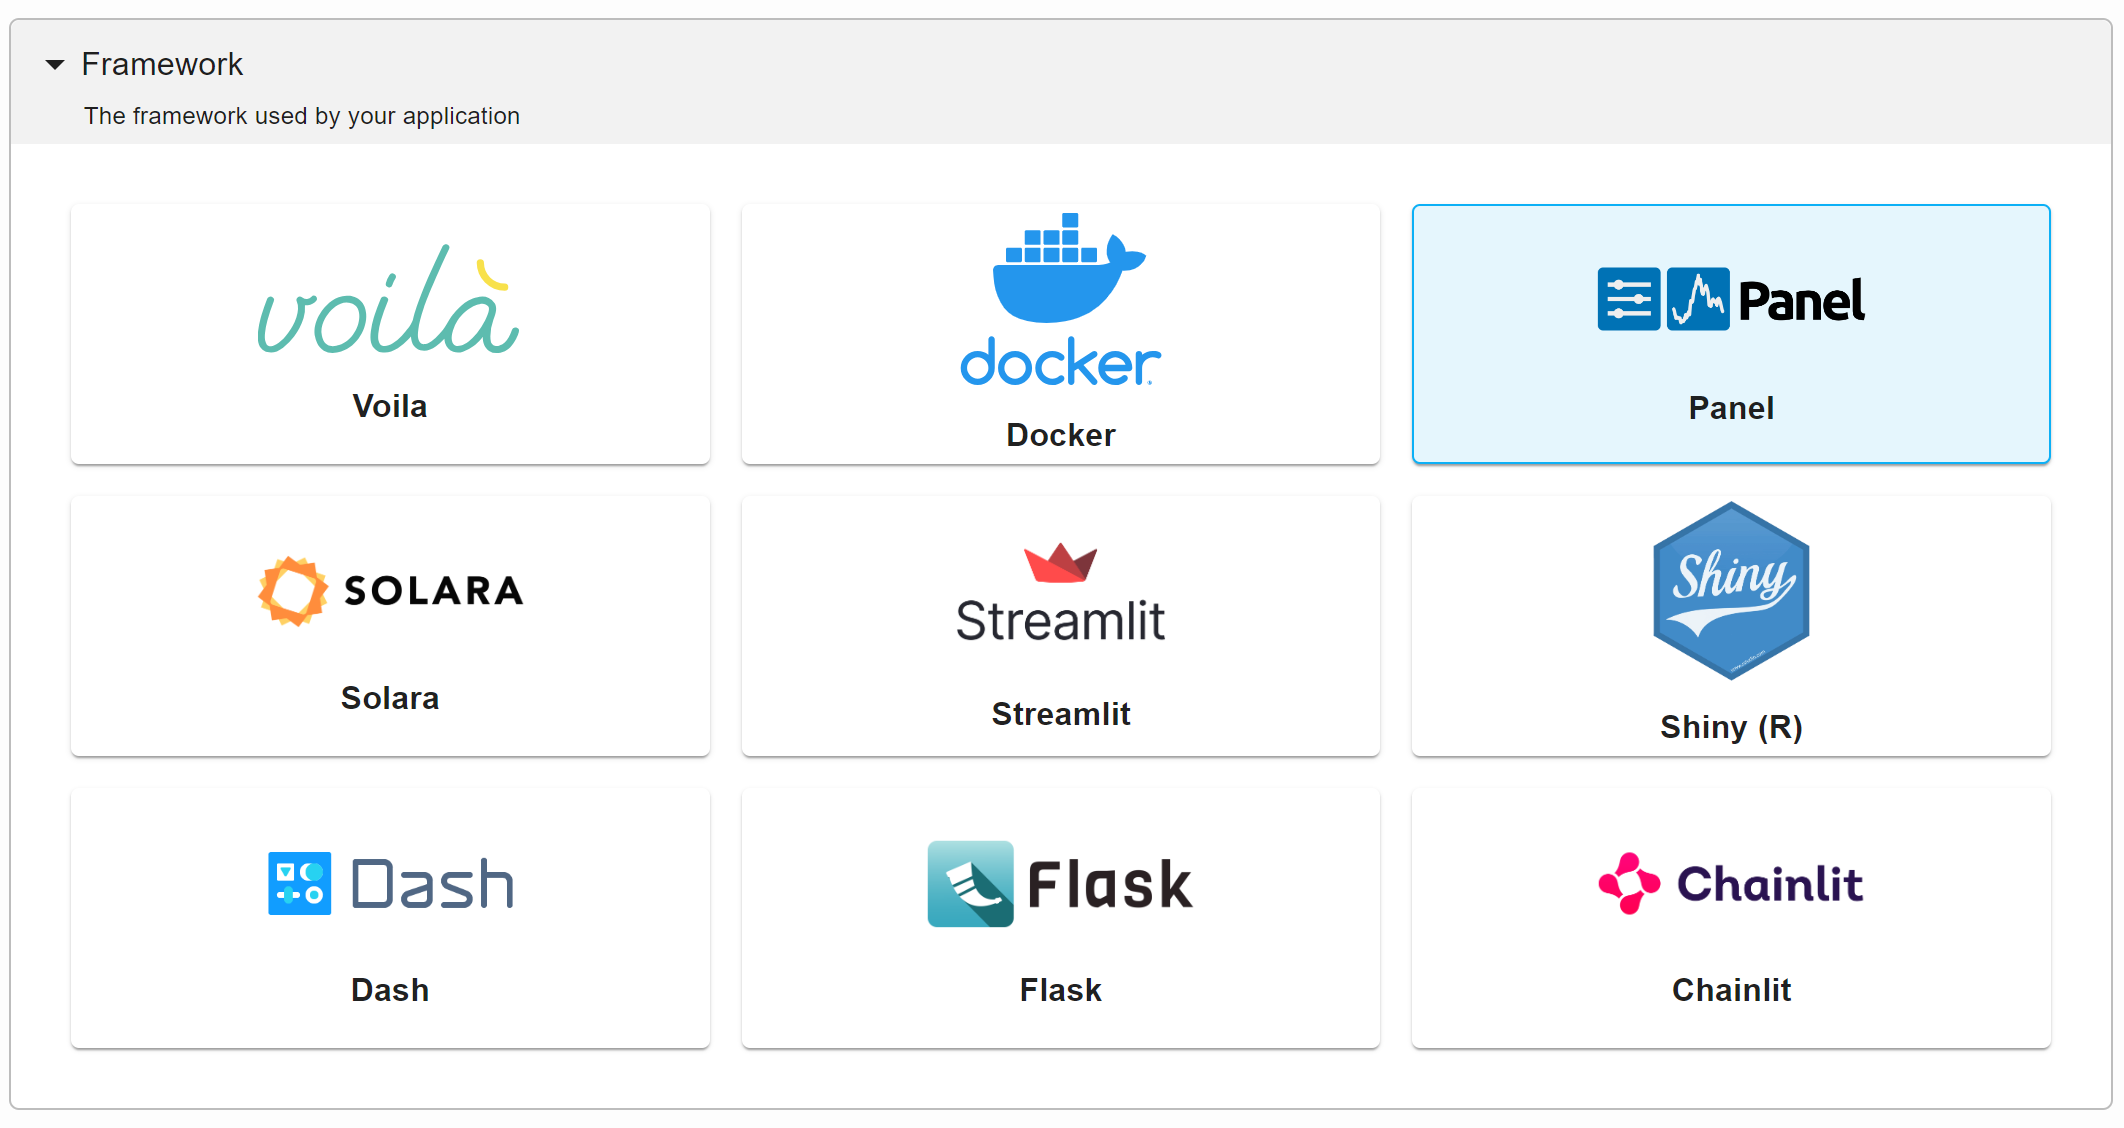
Next, scroll down to the Framework section and select Panel.
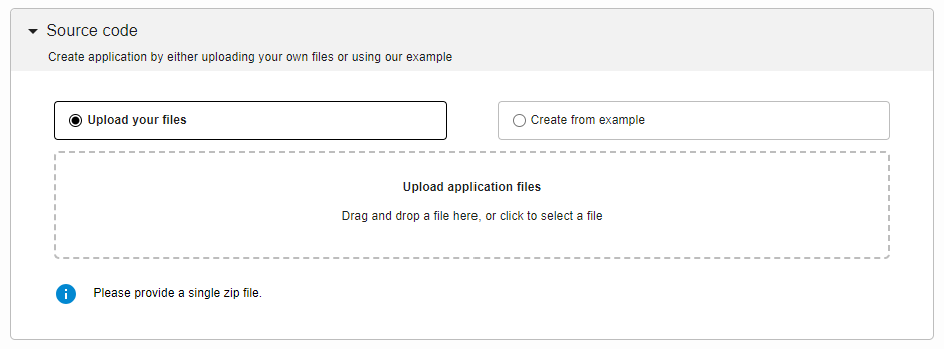
Navigate to the Source code section and upload your zipped folder.
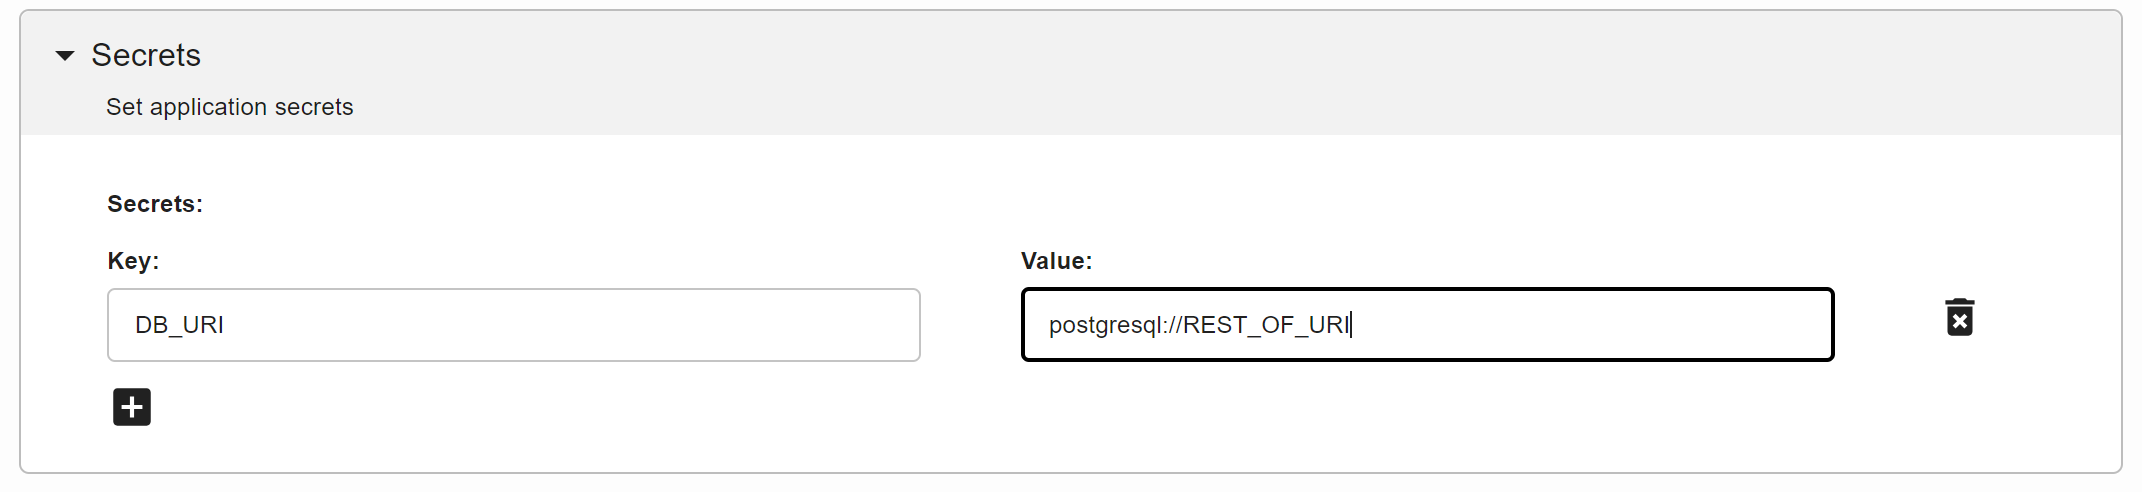
Lastly, and this is the most important part, under the Secrets section, add a new key called DB_URI and paste your DB_URI into the value section.
Now you are done configuring your application! Scroll down and click create and your app should begin deploying automatically. After it is deployed, you can access the application in the given link.
For more information on deploying Panel apps, check out the documentation here.
Panel is a versatile and powerful tool for creating interactive web apps and dashboards in Python. It is easy to use, highly customizable, and compatible with other popular Python data libraries. In this blog post, we showed how useful it is to connect a relational database such as PostgreSQL to our application. In our EDA dashboard app of the Wine Quality dataset, we were able to query data directly from our database and incorporate it in our app. We enhanced interactivity by using widgets and the pn.bind method, allowing our app components to update dynamically based on user input. Overall, this approach of connecting a PostgreSQL database to a Panel application is a powerful option for your data visualization needs.
Here are the steps for deploying this application using the CLI.
ploomber-cloudpip install ploomber-cloud
ploomber-cloud key YOURKEY
ploomber-cloud init
This will create a ploomber-cloud.json file with your project information.
To do this, add a file called .env in your project directory containing the following:
DB_URI = "YOUR_URI"
Make sure to replace YOUR_URI with your database URI. This creates a secret environmental variable called DB_URI that holds your URI.
ploomber-cloud deployBy default, this will compress all the files in your directory and upload it to the cloud. You will then be given a link that looks like https://www.platform.ploomber.io/applications/your-project where you can monitor the deployment of your application.
For more information about the CLI and additional customization you can perform while deploying, check out the CLI documentation here.
Seamless deployment for data scientists and developers. Ploomber handles infrastructure so you focus on building. Secure and scalable—from personal projects to enterprise apps. Support for Streamlit, Dash, Docker, and AI-powered applications. Because life's too short for deployment headaches.

