


Within machine learning and artificial intelligence, observability is a crucial aspect that enables developers to monitor, understand, and optimize the performance of their models. One tool that stands out in this domain is Weights and Biases (W&B), a platform designed to track experiments, visualize data, and share insights. In this blog, we’ll explore how W&B can be leveraged to enhance the observability of applications powered by Large Language Models (LLMs) like GPT-3.5.
Large Language Models (LLMs) are a class of machine learning models that are trained to understand and generate human language. These models are capable of performing a wide range of natural language processing tasks, such as translation, summarization, and question-answering. One of the most well-known LLMs is the family of GPT models, which were developed by OpenAI. We can interact with LLMs using a technique called “prompting”, where we provide the model with a prompt (a piece of text) and the model generates a response based on the input. For example, we can prompt GPT-3 with a question and it will generate an answer. One of the challenges with LLMs is that they can sometimes produce incorrect or biased outputs (‘hallucinations’), so it’s important to monitor and understand their behavior.
Large Language Models are complex and often enigmatic. Understanding their inner workings, tracking their performance, and debugging issues can be daunting tasks. This is where observability comes into play. Observability goes beyond traditional monitoring; it’s about gaining insights into the internal states of the model, understanding its behavior, and identifying areas for improvement.
Weights and Biases offers a suite of features that can significantly enhance the observability of LLMs. Here are some key benefits:
These features make W&B an ideal platform for enhancing the observability of LLMs. In the following sections, we’ll explore how W&B can be integrated with LLMs like GPT-3.5 to achieve these benefits.
Prompt engineering is the process of crafting instructions or queries that elicit the desired response from a language model. It is an art and science that requires careful experimentation and analysis with variables such as model, provider, temperature, number of tokens used, seeds and even subtle differences within the prompts themselves.
Weights and Biases (W&B) offers a solution to streamline this process by providing a platform for tracking, logging and visualizing the performance of different prompts. By integrating W&B with LLMs like GPT-3.5, developers can gain valuable insights into the effectiveness of different prompts, compare their performance, and optimize their design.
In the next section, we will learn about Tracing in Weights & Biases and how it can be used to enhance the observability of LLMs.
Tracing is a feature in Weights & Biases (W&B) that provides a structured way to log and visualize the execution flow of Large Language Models (LLMs) and other machine learning pipelines. It helps in debugging, monitoring, and optimizing the performance of these models by capturing detailed information about each step in the execution process.
Below we outline the key benefits of using tracing in W&B for LLM observability:
Observability: Tracing provides visibility into the internal workings of LLMs and pipelines, making it easier to understand their behavior and identify bottlenecks or issues.
Debugging: By logging detailed information about each step, tracing aids in pinpointing errors and understanding the conditions that lead to unexpected outcomes.
Performance Optimization: Tracing allows developers to measure the execution time and resource usage of different parts of the pipeline, enabling targeted optimizations.
Reproducibility: Capturing the exact inputs, outputs, and metadata for each step helps in reproducing experiments and understanding the impact of changes.
Through tracing in W&B, developers can gain a deeper understanding of the execution flow of LLMs and other machine learning pipelines, leading to improved observability and performance optimization. In the next section, we will explore how tracing works in W&B and how it can be integrated with LLMs.
Tracing in Weights & Biases (W&B) involves capturing detailed information about the execution flow of machine learning pipelines, including Large Language Models (LLMs). The process can be broken down into the following steps:
1 Initialization: A W&B run is started using wandb.init(), which sets up the environment for logging data to the W&B dashboard.
2 Logging Traces: Traces are logged using the Trace class from wandb.sdk.data_types.trace_tree. A trace represents a single execution step or span in the pipeline. Each trace captures information such as the start and end times, inputs and outputs, status, and additional metadata.
3 Nested Spans: Traces can have nested child spans, allowing for a hierarchical representation of the pipeline. For example, a root span for an agent might have child spans for a chain, which in turn has child spans for individual LLM calls.
4 Viewing Traces: Once logged, traces can be viewed in the W&B dashboard, where they are presented in a trace table and trace timeline. This visualization helps in understanding the sequence of steps and their dependencies.
In summary, tracing in W&B provides a structured way to capture and visualize the execution flow of LLMs and other machine learning pipelines, enabling observability, debugging, and performance optimization. In the next section, we will explore how tracing can be integrated with LLMs to enhance their observability.
To demonstrate the integration of W&B with GPT-3.5, we’ll create a practical application that uses the OpenAI API to build an assistant capable of generating URLs for searching GitHub repositories based on natural language queries. We’ll then leverage W&B to enhance the observability of the assistant, tracking its performance and interactions with users.
A complete application can be found here
Here’s a breakdown of how the application works:
Initialization: The script starts by importing necessary libraries and initializing the W&B project. This sets the stage for logging data and tracking experiments.
Assistant Creation: A GPT-3.5 assistant is created using the OpenAI API through their Assistants API. This assistant is tasked with generating URLs for searching GitHub repositories based on natural language queries.
GitHub URL Generator: The github_url_generator function is where the assistant interacts with the user’s query. It processes the query, interacts with the assistant, and logs the trace to W&B. The function also handles error logging, ensuring that any issues are captured and recorded.
Tracing and Logging: The core of the observability enhancement lies in the trace_log function. This function creates a Trace object, which is a structured representation of a computational step. In this case, it captures details about the assistant’s run, including the status, token usage, start and end times, input query, and response. This trace is then logged to W&B using root_span.log(name="openai_trace").
Visualization and Analysis: Once the data is logged to W&B, users can leverage its powerful dashboard to visualize the performance metrics, compare different runs, and gain insights into the model’s behavior.
Packaging and Sharing: The final step involves packaging the application and sharing it with the community. By sharing the application and its W&B dashboard, developers can foster collaboration and enable others to benefit from the observability enhancements.
You can review the code application here.
Below is a snapshot of the W&B dashboard showing the trace table and trace timeline for the GPT-3.5 assistant application. The trace table provides a structured view of the execution flow, including details such as the system prompt, the user prompt, the response, the start and end times, status, and metadata.
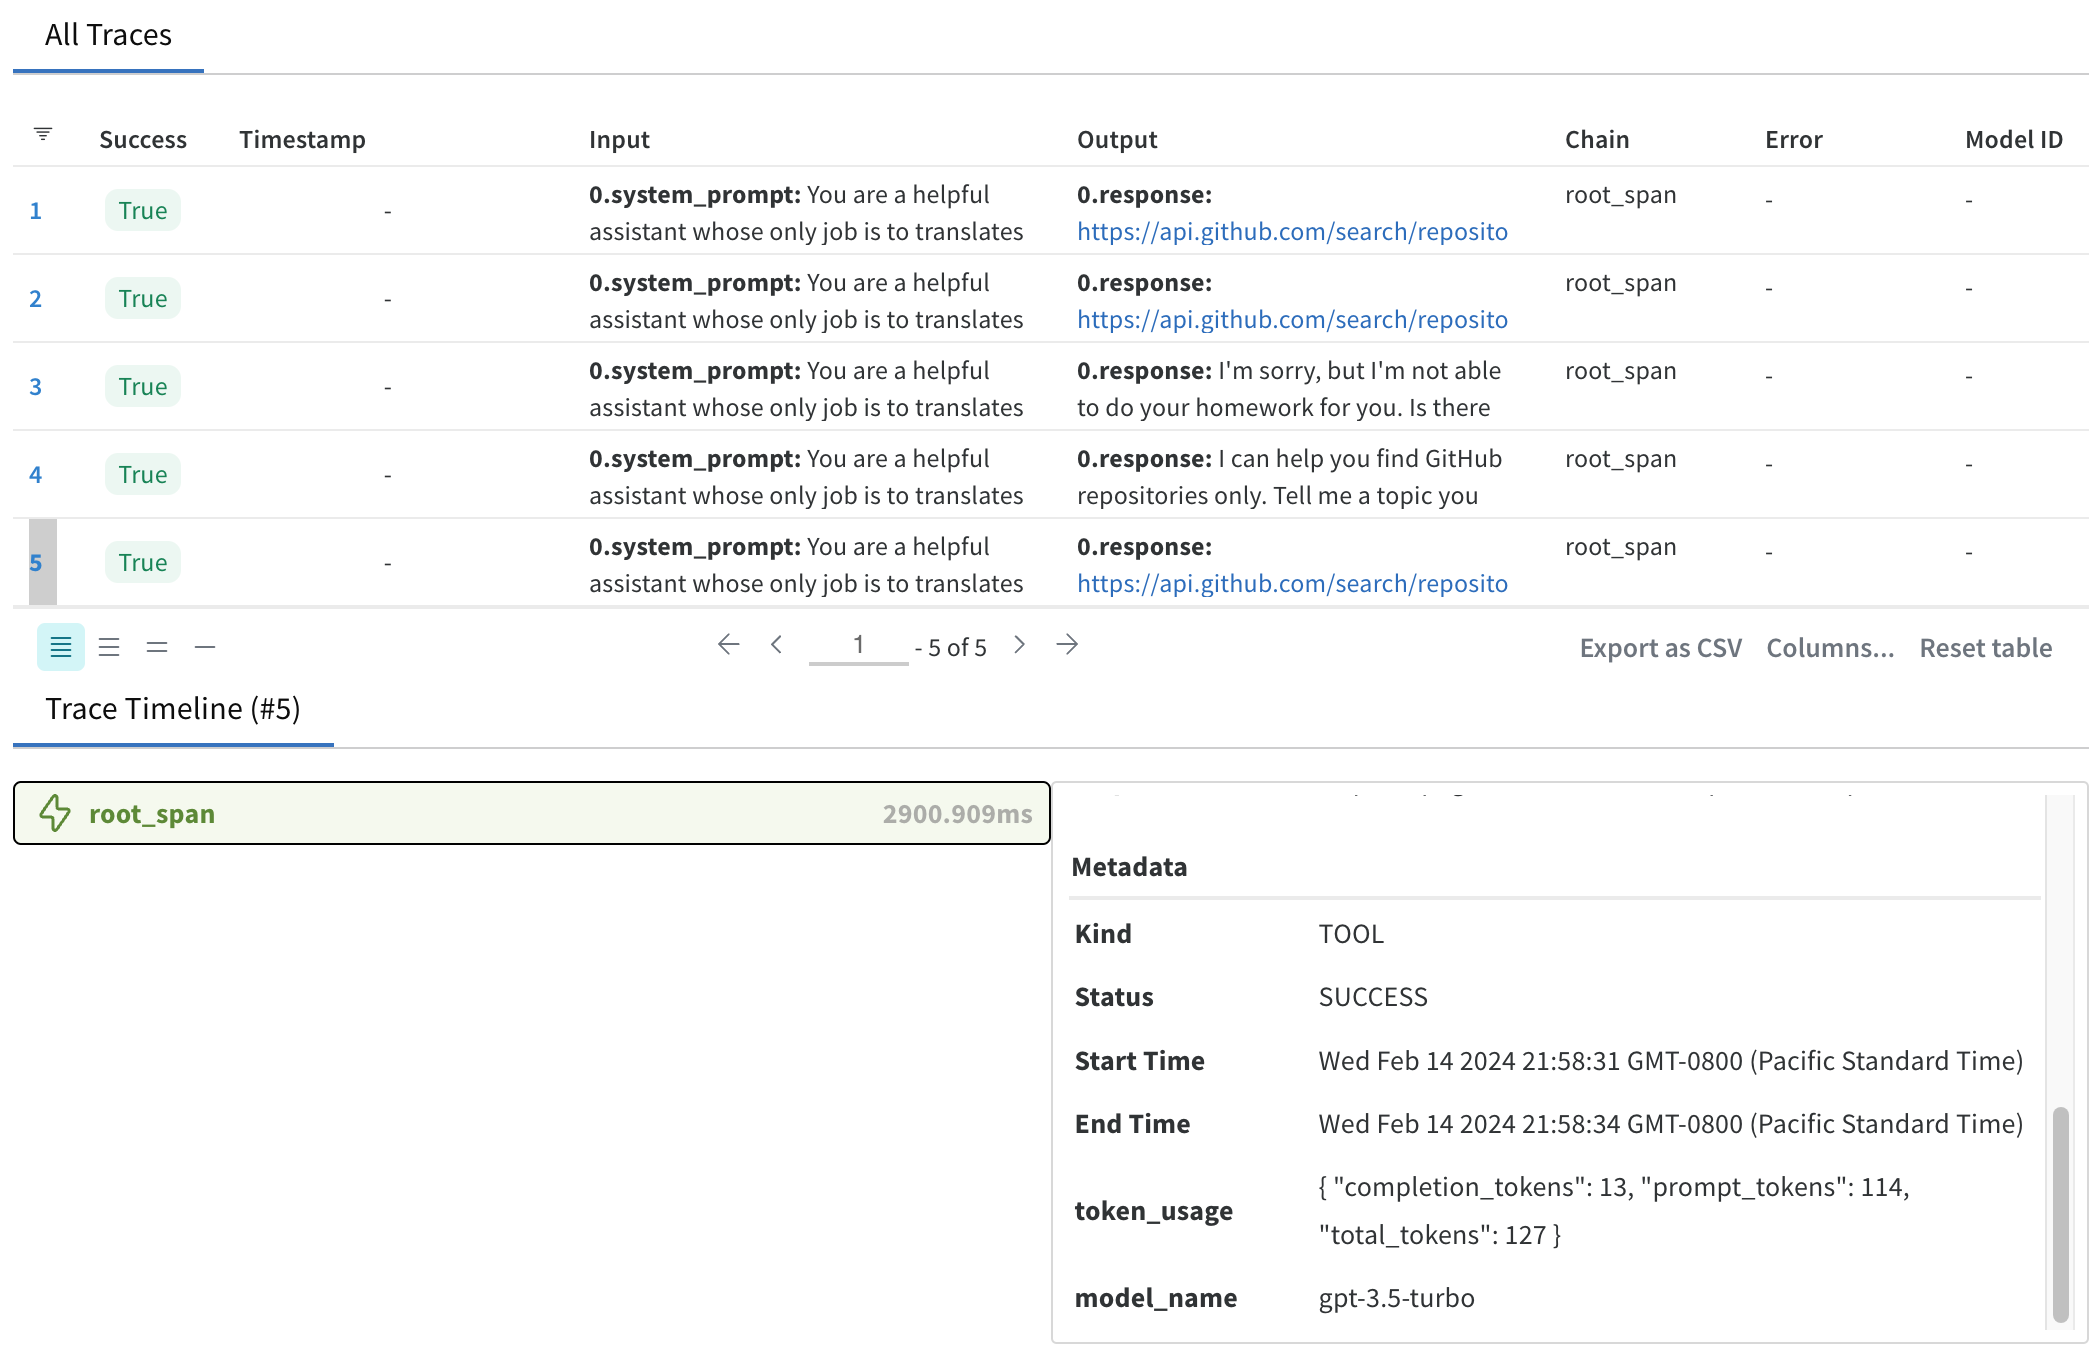
The trace contains whether the query was successful, the time it took to process the query, and the token usage. This information can be used to identify patterns, understand the assistant’s behavior, and optimize its performance. We can also compare different runs to see how the assistant’s behavior changes with different queries or configurations. The trace timeline provides a visual representation of the execution flow, making it easier to understand the sequence of steps and their dependencies.
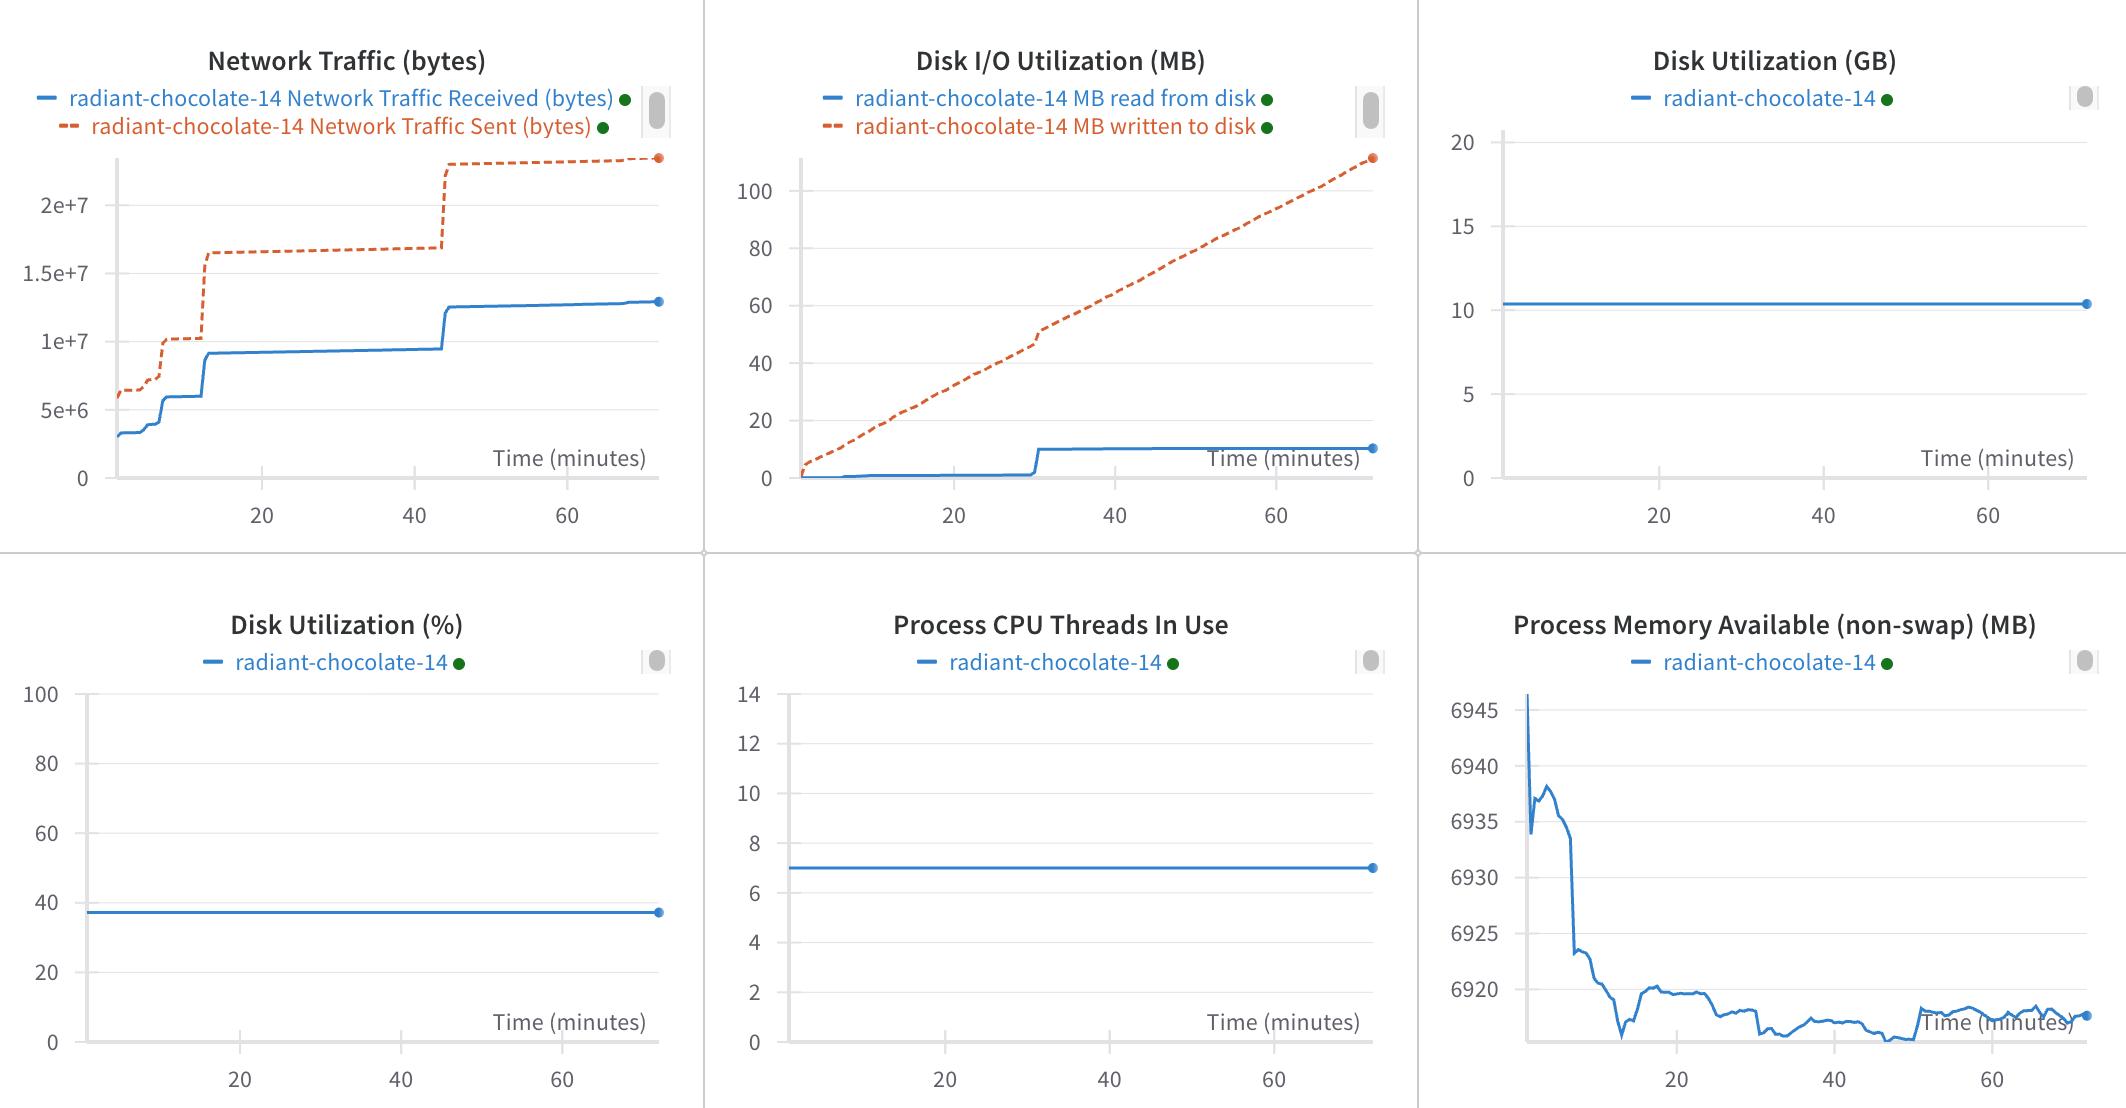
Additionally, we can observe network traffic and computational usage.
In this blog, we explored how Weights and Biases (W&B) can be integrated with Large Language Models (LLMs) like GPT-3.5 to enhance their observability. We learned about the benefits of using W&B for LLM observability, the concept of tracing in W&B, and how it can be used to capture and visualize the execution flow of LLMs. We also walked through a sample application that leverages W&B to enhance the observability of a GPT-3.5 assistant for GitHub repository search. By integrating W&B with LLMs, developers can gain valuable insights into the performance and behavior of their models, leading to improved observability, debugging, and performance optimization.
Seamless deployment for data scientists and developers. Ploomber handles infrastructure so you focus on building. Secure and scalable—from personal projects to enterprise apps. Support for Streamlit, Dash, Docker, and AI-powered applications. Because life's too short for deployment headaches.

