


Update: We released soorgeon, a tool that automatically refactors legacy notebooks!
In the first part of this series, we described how to go from a legacy notebook to a single-task pipeline that we can execute with ploomber build. In this second part, we’ll break the monolithic notebook and modularize our work into smaller tasks.
Projects that live on a single file are hard to debug because variables may interact unexpectedly. So instead, we want a structured project with clear boundaries where the output of a “task” becomes the input of the next one; we call this a data pipeline.
At this step, we go over the code to identify where we should split the notebook. For example, say your notebook looks like this:
from my_project import clean, plot
import pandas as pd

df = pd.read_csv('/path/to/data.csv')


df['numbers'] = clean.numbers(df['numbers'])
df['names'] = clean.names(df['names'])
# more cleaning code...


plot.numbers(df.numbers)
plot.names_frequency(df.names)
# more plotting code...
Your code will likely be more extensive and messier than this example, but the objective is to define splits between code sections. For instance, in this example, we’re doing three things to the data: loading it, cleaning it, and plotting it; hence, we can break it into three sections. We do so by adding Markdown headings so we can quickly identify where each section starts and finishes (to learn how to insert Markdown cells in Jupyter, click here).
from my_project import clean, plot
import pandas as pd

# My Amazing Data Science Project (H1 heading)

## Data Loading (H2 heading)

df = pd.read_csv('/path/to/data.csv')

## Cleaning (H2 heading)

df['numbers'] = clean.numbers(df['numbers'])
df['names'] = clean.names(df['names'])
# more cleaning code...

## Plotting (H2 heading)

plot.numbers(df.numbers)
plot.names_frequency(df.names)
# more plotting code...
Note: Markdown has multiple types of headings; an H1 heading looks like
this # I'm an H1 heading, while an H2 heading looks like
this: ## I'm an H2 heading.
Most notebooks are a lot more chaotic than this one, so you may need to re-organize the code cells a bit before you can define the sections. If you’re loading more than one dataset, ensure that each section processes only one dataset at a time:
# pipeline.ipynb
# My amazing project (H1 heading)

## Load dataset A (H2 heading)
# ...

## Load dataset B (H2 heading)
# ...

## Clean dataset A (H2 heading)
# ...

## Clean dataset B (H2 heading)
# ...

## Merge datasets A and B (H2 heading)
# ...

## Plot datasets A and B (H2 heading)
# ...
Go to the next step once you have defined your notebook’s sections.
This step is where we finally break down the monolith and start assembling a multi-stage pipeline. By providing explicit boundaries among tasks, we establish a more precise purpose for each and can quickly test our outputs.
Defining task boundaries is somewhat arbitrary, but here are a few rules of thumb:
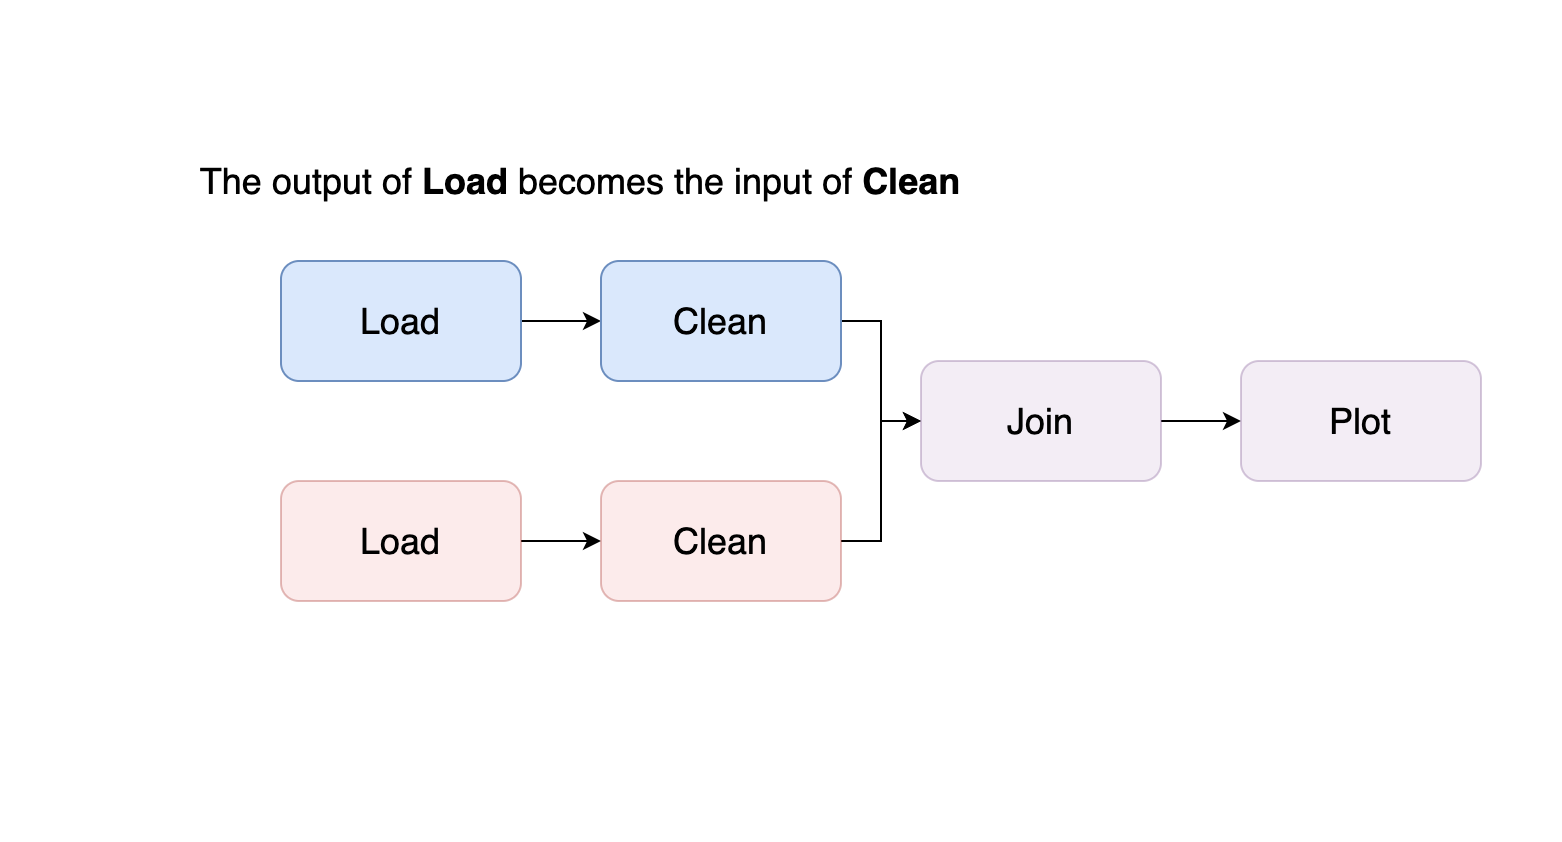
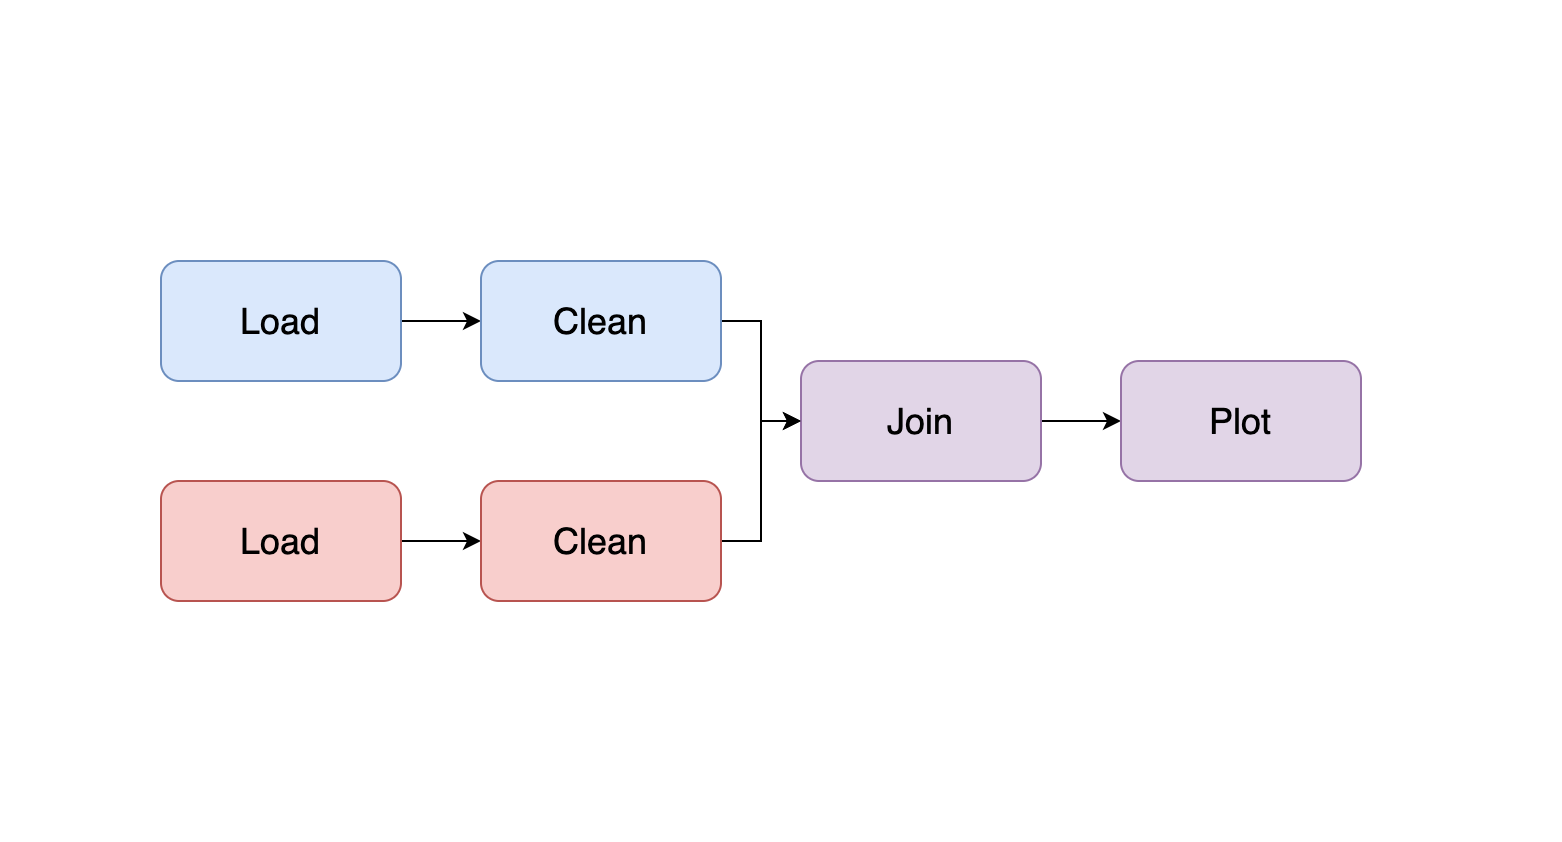
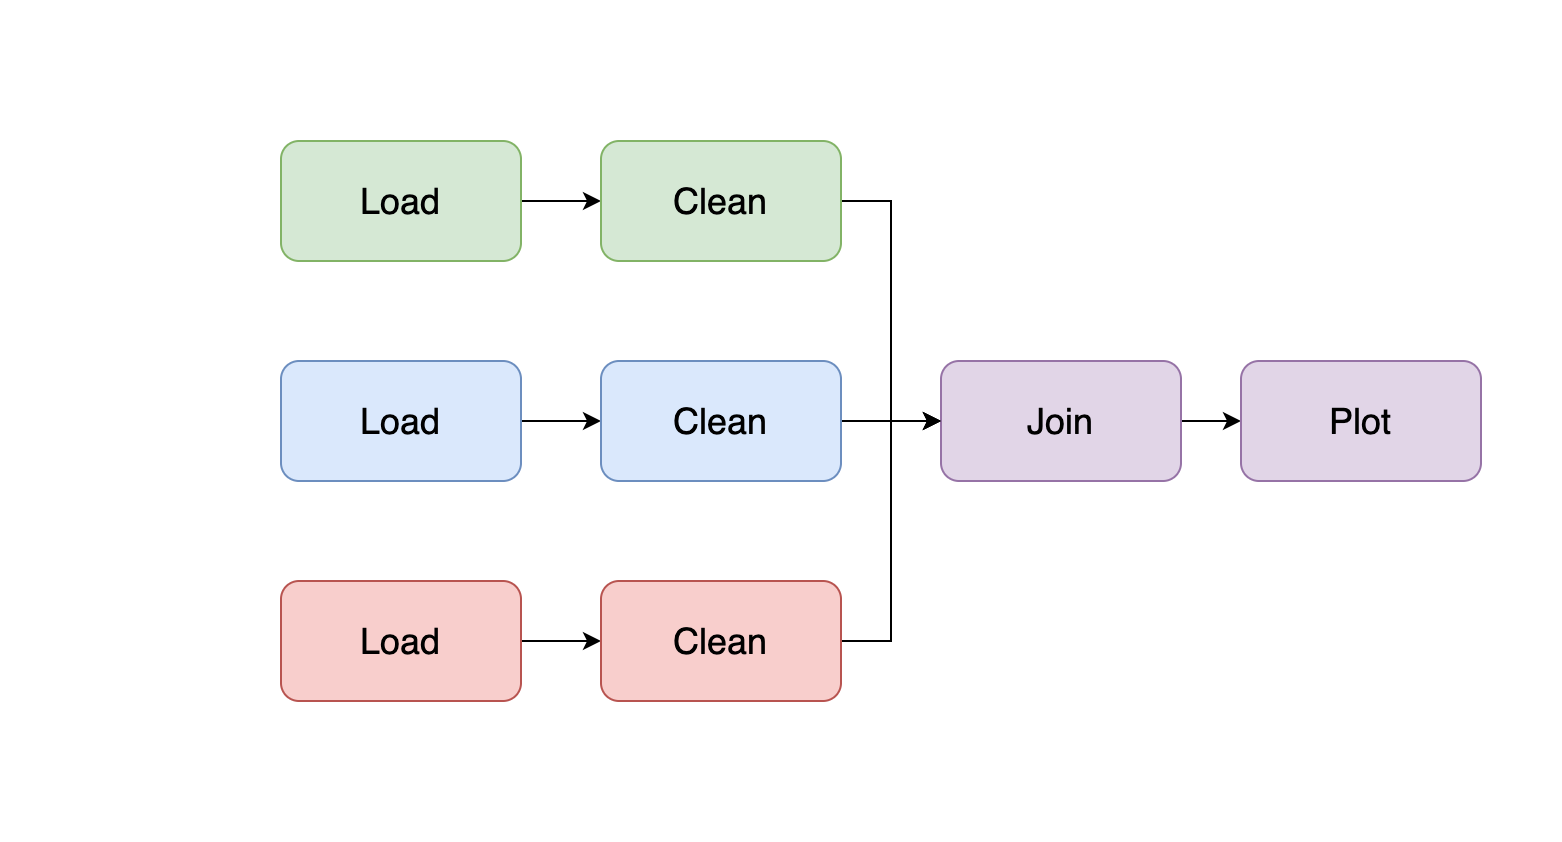
For example, assuming we have two datasets that need loading, cleaning, and plotting, we want our pipeline to look like this:
So now it’s time to split our project into two files. We apply the cuts backward, following our example, the first cut we make is at the end of our notebook:
# pipeline.ipynb

## Load dataset A
# ...

## Load dataset B
# ...

## Clean dataset A
# ...

## Clean dataset B
# ...

## Merge datasets A and B
# ...

# SPLIT PIPELINE HERE!

## Plot datasets A and B
# ...
We move the code that plots our data into a new script and edit our pipeline.yaml file:
tasks:
    - source: pipeline.py
      product:
        nb: report.ipynb
        data: merged.csv
      params:
        sample: True

    - source: plot.py
      product: plot.ipynb
Once you edit the pipeline.yaml file, you execute the following command to generate the plot.py file:
ploomber scaffold
We’re making a few changes here. First, we modify the first product of the first task because it now generates two outputs: the notebook and the clean version of dataset B. Then, we added a new task, which executes plot.py (copy the code that plots dataset B over here) and generates another notebook.
We want to achieve the following:
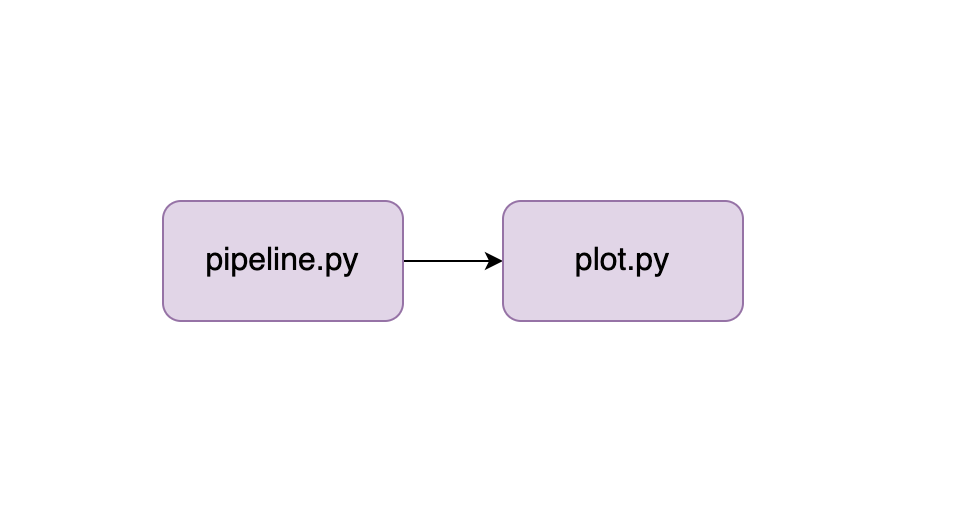
How to achieve so requires explaining how to build pipelines in Ploomber. It’s simple, and you only need to make a few code modifications and move the plotting code to plot.py; check out our complete example in the documentation.
Once you learn the basics of Ploomber, repeat the same process until you have a pipeline with many small scripts. Ensure that you run your pipeline with ploomber build and check that the output still matches.
Until this point, we’ve manually checked the executed notebook’s output from each pipeline task to ensure that results still matched after making a change. Unfortunately, this isn’t practical in the long run, so let’s automate it.
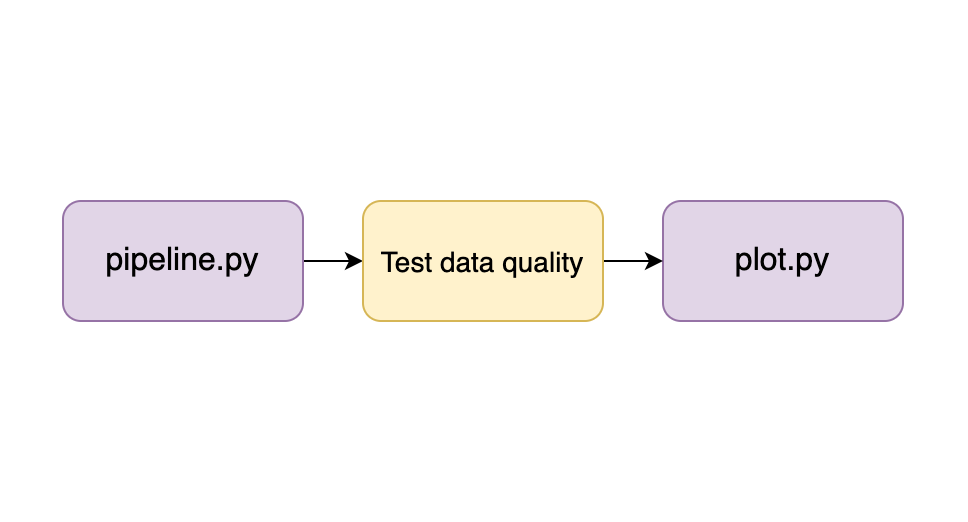
Structuring our pipeline allows us to embed integration tests that verify the integrity of each output. For example, let’s assume that we already broke down our analysis into two steps (as displayed in the image in the previous section); we can test the outputs of each task before we execute the next one:
To test our pipeline’s tasks, we can define some desirable properties at each stage; for example, we may state that the clean version of dataset B must have the following properties:
ageage with positive numbers smaller than 100category must have values a, b, or cWe can convert such data expectations into integration tests to verify them every time we run our pipeline. The simplest way to do this is to add some assert statements at the end of each task:
# example code to test data quality
# assume df is a pandas data frame

# no NAs in column age
assert not df.age.sum()

# age column between 0 and 100
assert df.age.min() > 0 and df.age.max() < 100

# column category must have values: a, b, c
assert set(df.category.unique()) == {'a', 'b', 'c'}
Alternatively, we can use the Ploomber on_finish hook to run an arbitrary function after a task executes correctly. For a complete example, check out our pipeline testing tutorial.
Testing data pipelines is tricky; check out the talk I gave at PyData Global 2020 where I cover this in detail.
git pushSo far, we’ve been testing our pipeline locally by executing ploomber build. However, it’s best to automate pipeline execution on each git push; to enable automated testing is to create a small script that installs dependencies and runs our pipeline:
# install dependencies
pip install -r requirements.lock.txt

# run pipeline with a sample
ploomber build --env--sample true
How to run some script on each git push depends on the git service we use. For example, if using GitHub, we can use GitHub Actions, all services for hosting git repositories offer something similar; check out the documentation of your git service to know more.
Congratulations! You now have a robust and maintainable pipeline that allows you to introduce changes more rapidly and with more confidence. But remember always to keep it that way; if not taken care of, it’s easy to degrade a pipeline into something similar to what we’ve started with. So here are a few tips for covering scenarios that you’re likely to encounter.
Whenever you have to modify a task, do so in small steps, and run your pipeline to ensure that everything works correctly after every minor modification.
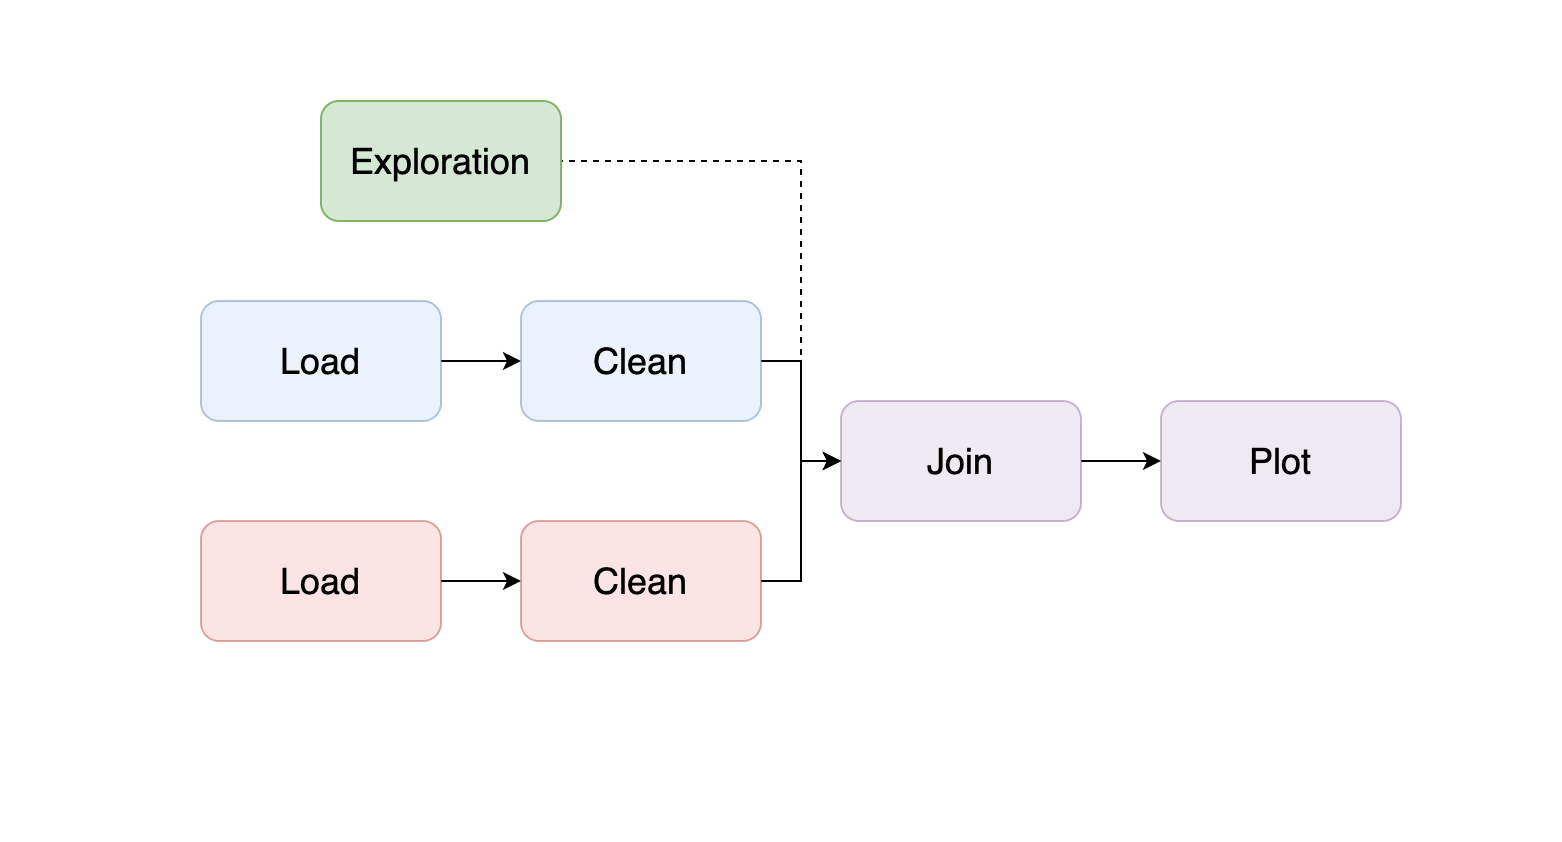
If you need to add a new dataset to your analysis, create a new notebook. Then, explore the data until you gain a basic understanding of it and make a call on whether to incorporate it into your pipeline or not.
If you decide to incorporate the dataset into the pipeline, add a new branch to the pipeline by incorporating your exploratory code as a new task (remember to convert your .ipynb into a .py file):
As you learn more about the data, you may start adding code to clean it, and if you’re developing a Machine Learning pipeline, you may start creating features; so break down the logic into smaller pieces; a typical structure is the following:
Remember to add integration tests. Also, ensure that the task that loads the take can take a sample argument to run your code with a data sample for quick testing.
Adding a new dataset is a milestone in your project, so ensure you document it. I highly recommend you create a CHANGELOG.md file to record these types of significant changes in your project:
# CHANGELOG

## 2021-11-11
* Added new dataset C
If a dataset is no longer needed, remove the entire branch that processes it. There is no point in keeping dead code. Ensure you document that in your CHANGELOG.md file.
# CHANGELOG

## 2021-11-12
* Deleted dataset A because X, Y and Z

## 2021-11-11
* Added new dataset C
To keep your project maintainable, t’s essential to keep your code readable. Packages such as flake8 and black are great options to lint your code and auto-format it. To learn more about linting and get tips on keeping your code clean, check out our guide on writing clean notebooks.
Converting a legacy notebook-based pipeline takes a lot of effort, but it’s worth the price. In my experience, many data projects fail because they’re built on weak foundations preventing them from making steady progress. By structuring your pipeline and testing it, you’re already ahead of the game, and you’ll be able to confidently make changes to your work and ensure that you can reproduce your results at any time.
Seamless deployment for data scientists and developers. Ploomber handles infrastructure so you focus on building. Secure and scalable—from personal projects to enterprise apps. Support for Streamlit, Dash, Docker, and AI-powered applications. Because life's too short for deployment headaches.

