


In this blog post, we will give you a basic introduction to regression. We will discuss what it is, how it works, and some of the benefits that it can provide.
Regression is a widely used technique in data science, and it can be used for a variety of purposes. In particular, we will focus on its use in predictive modeling. If you are new to machine learning or data science, then this is a great place to start!
Before we get into the details of regression, let’s take a step back and define what machine learning is. In general, machine learning is a process of teaching computers to make predictions based on data. This might sound like a simple task, but it can be quite difficult in practice. After all, humans have been making predictions for centuries, and we still don’t always get it right!
Machine learning is a subset of artificial intelligence, which is itself a subset of computer science. Machine learning generally falls into two broad categories: supervised and unsupervised learning. Supervised learning is where we have a dataset with known labels, and we want to use it to train our model to make predictions on new data. Unsupervised learning is where we have a dataset but no known labels, and we want the computer to learn from the data and find patterns on its own.
In this post, we’ll focus on supervised learning, specifically on a type of supervised learning called regression. Regression is a widely used technique, and it’s relatively easy to understand the basics. So if you’re new to machine learning, this could be a good place to start.
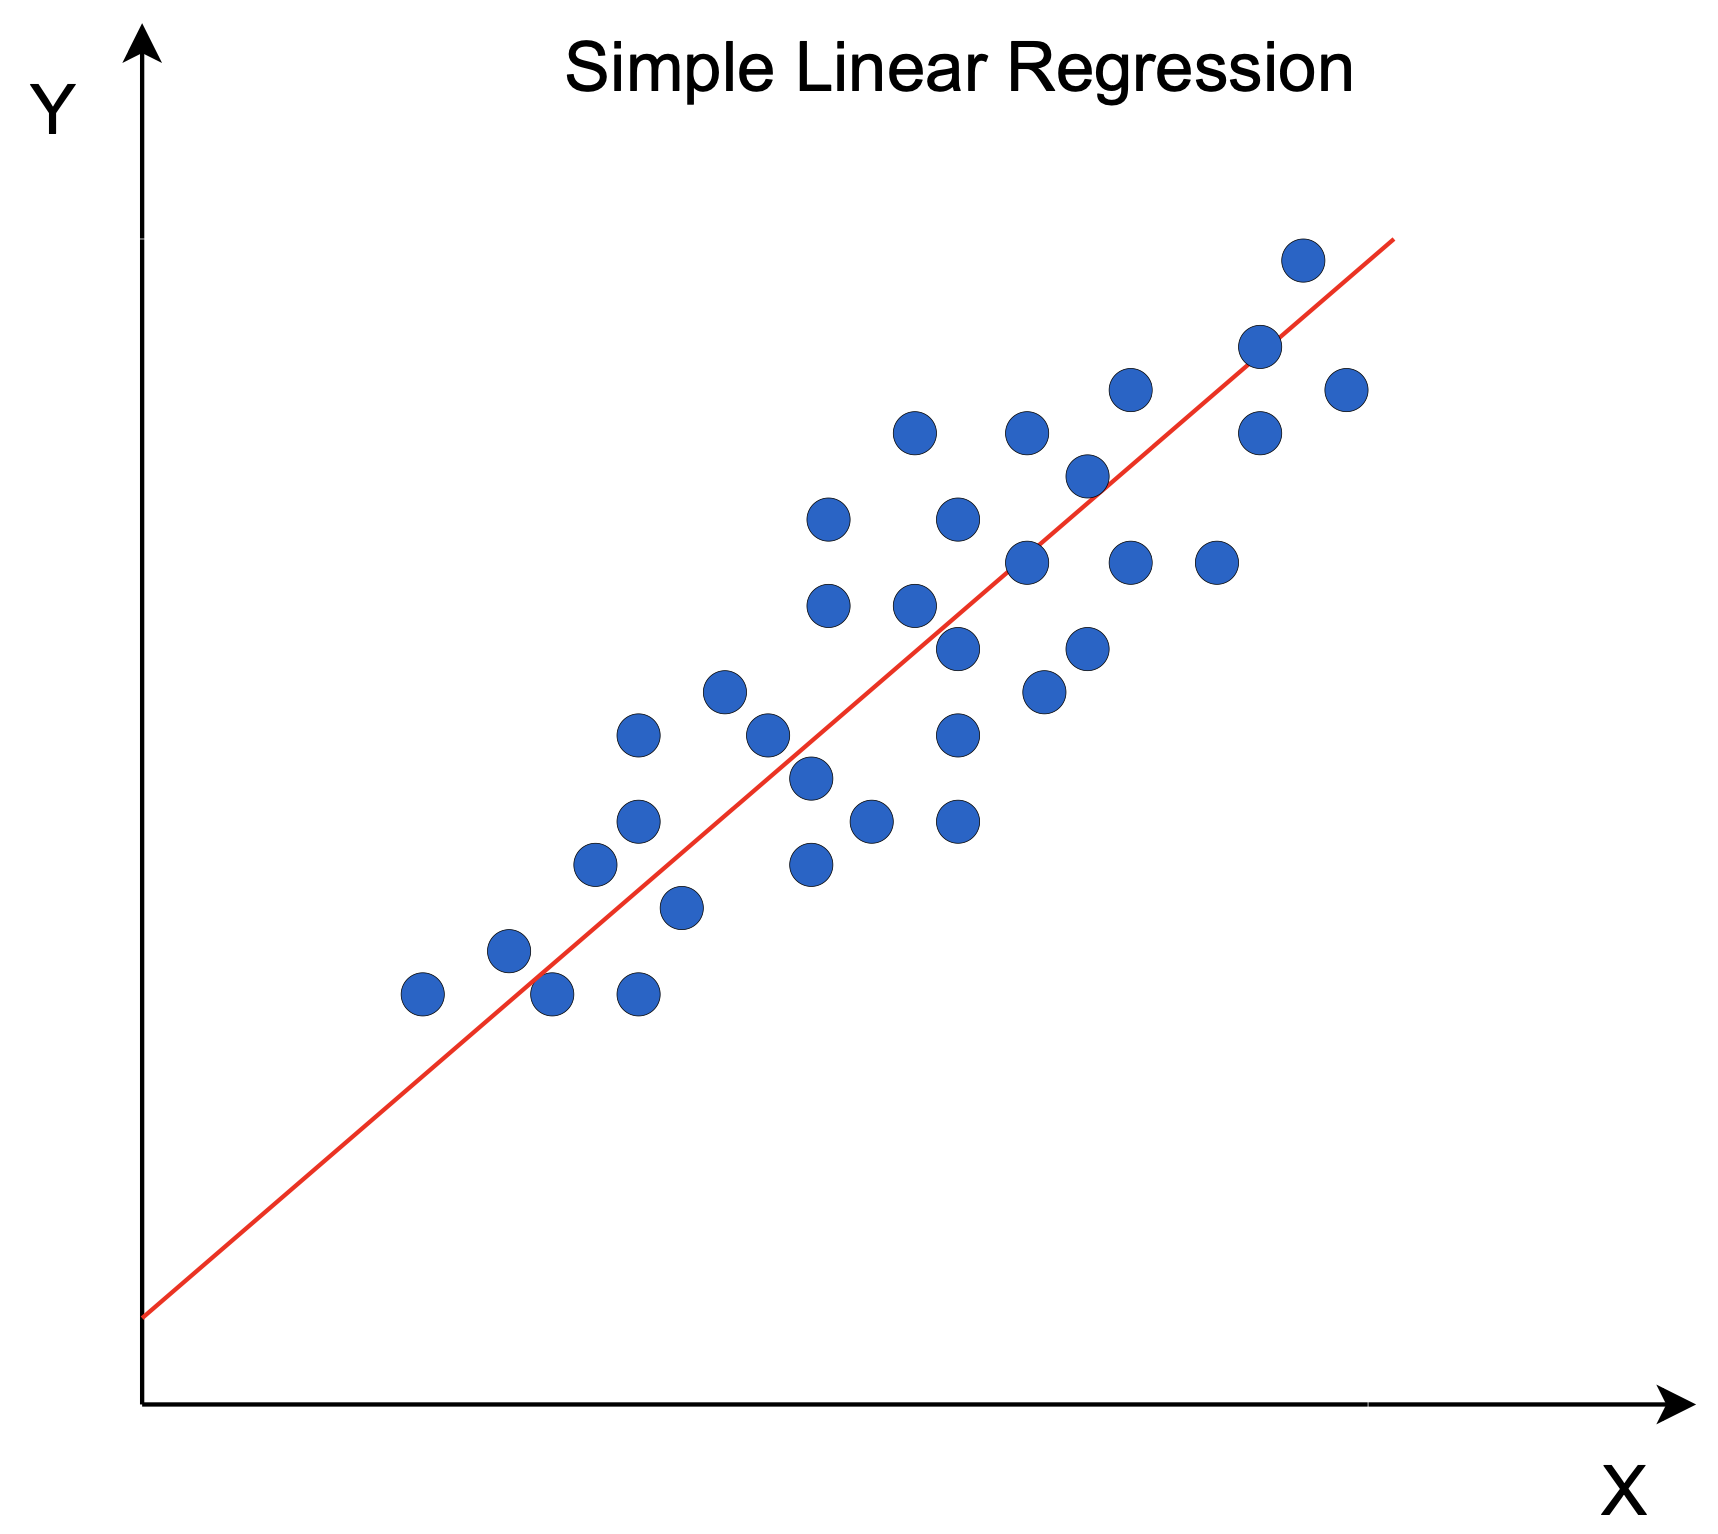
In its simplest form, regression is just a way of predicting one value (the dependent variable) based on another value (the independent variable). Linear regression is the most basic type of regression, although there are other types as well (more on that later). For example, we might use regression to predict someone’s age based on their height. In this case, age would be the dependent variable and height would be the independent variable.
Of course, in the real world things are usually more complicated than that. We might want to predict age based on height, weight, gender, and whether or not someone smokes. In this case, we would still say that age is the dependent variable, but now we have four independent variables: height, weight, gender, and smoking status. So in our example above, we might say that age is equal to some constant plus a times height plus b times weight plus c times gender (where male = 0 and female = 1) plus d times smoking status (where non-smoker = 0 and smoker = 1).
We can write this mathematically as:
$age = a * height + b * weight + c * gender + d * smoking status$
or
$Y = aX + b$
where Y is the dependent variable (age), X is the independent variable vector ([height, weight, gender, smoking status]), and a and b are constant values. The challenge in linear regression is to determine the values of a and b that best fit the data.
There are a number of ways to do this, but one common method is called “least squares.” Least squares simply means that we are looking for the line that minimizes the sum of squared errors between our predicted values and the actual values. In other words, we are looking for the line that is as close to all of our data points as possible. To find this line, we can use a technique called gradient descent.
Gradient descent is an iterative algorithm that starts with a guess for the values of a and b. At each step, the algorithm moves in the direction that minimizes the error. Eventually, the algorithm converges on the least squares line. There are a number of variations on gradient descent, but this is the basic idea.
How is linear regression used in machine learning? Now that we understand how linear regression works, let’s take a look at how we can use it for machine learning. In machine learning, we are usually working with much more data than we can possibly plot. Instead of trying to find the line by hand, we can use a computer to do it for us. To do this, we need to choose a loss function.
A loss function is a way of measuring how far off our predictions are from the actual values. There are a number of different loss functions, but the most common is the mean squared error. The mean squared error is simply the average of the square of the difference between our predicted values and the actual values. We can minimize this error by using gradient descent to find the line that minimizes the error. This line is called the regression line.
Once we have found the regression line, we can use it to make predictions about new data. This is how linear regression is used in machine learning. Of course, there are more complicated ways of doing linear regression, but this is the basic idea.
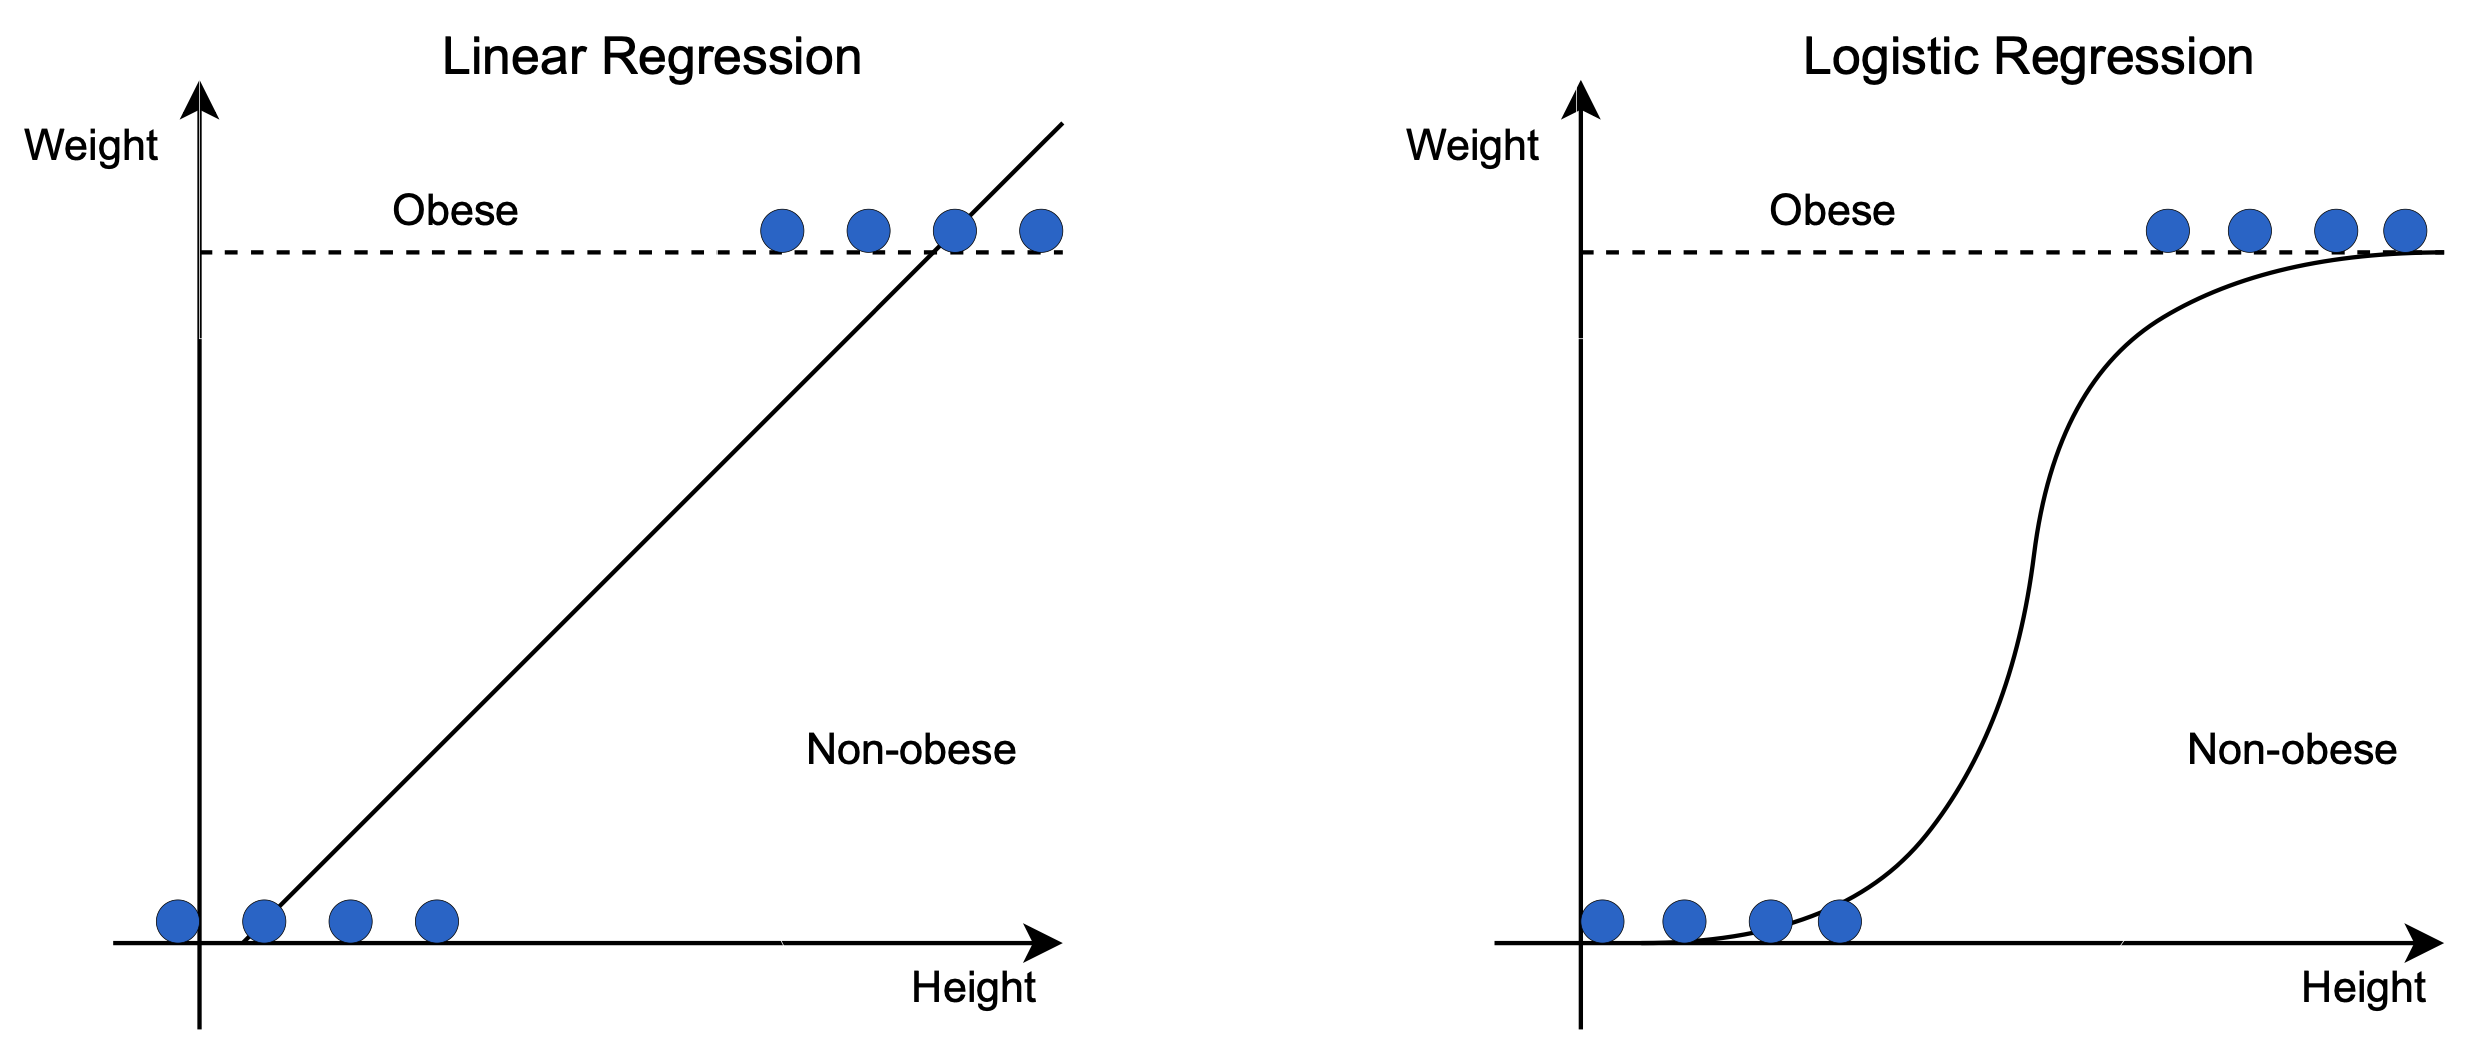
Linear regression is just one type of regression. There are many others, such as logistic regression, polynomial regression, and stepwise regression. Of these, logistic and linear are the most commonly used.
Each has its own strengths and weaknesses, and each is better suited for certain types of data. In general, though, all regressions work by finding the line (or curve) that best fits a set of data.
Logistic regression works by taking a set of data and finding the line (or curve) that best fits that data. The line is then used to make predictions about new data. For example, we could use logistic regression to predict whether or not someone will click on an ad.
To do this, we would take a set of data that includes whether or not people clicked on an ad, and what features they had (such as age, gender, location, etc). We would then find the line that best fits that data.
Once we have the line, we can use it to make predictions about new data. If someone comes to our website and we know their age, gender, and location, we can use our logistic regression model to predict whether or not they are likely to click on an ad.
Less commonly used than linear regression, polynomial and stepwise regression are two other types of regression that you may come across.
Polynomial regression is a type of linear regression in which the relationships between the independent variable x and the dependent variable y are modeled as nth-degree polynomials.
Stepwise regression is a method of fitting linear models in which the choice of predictive variables is automated by selecting those which improve the model most according to some statistical criterion.
Both methods can be useful in certain situations but should be used with caution as they can sometimes lead to overfitting.
One common issue with using regression is multicollinearity, which occurs when there is more than one predictor variable in a model that is highly correlated with each other. This can lead to problems with interpretation as well as stability of the estimates.
Another common issue is nonlinearity, which can occur when the relationship between the predictor and outcome variables is not linear. This can be addressed by using transformation techniques such as polynomial regression or splines.
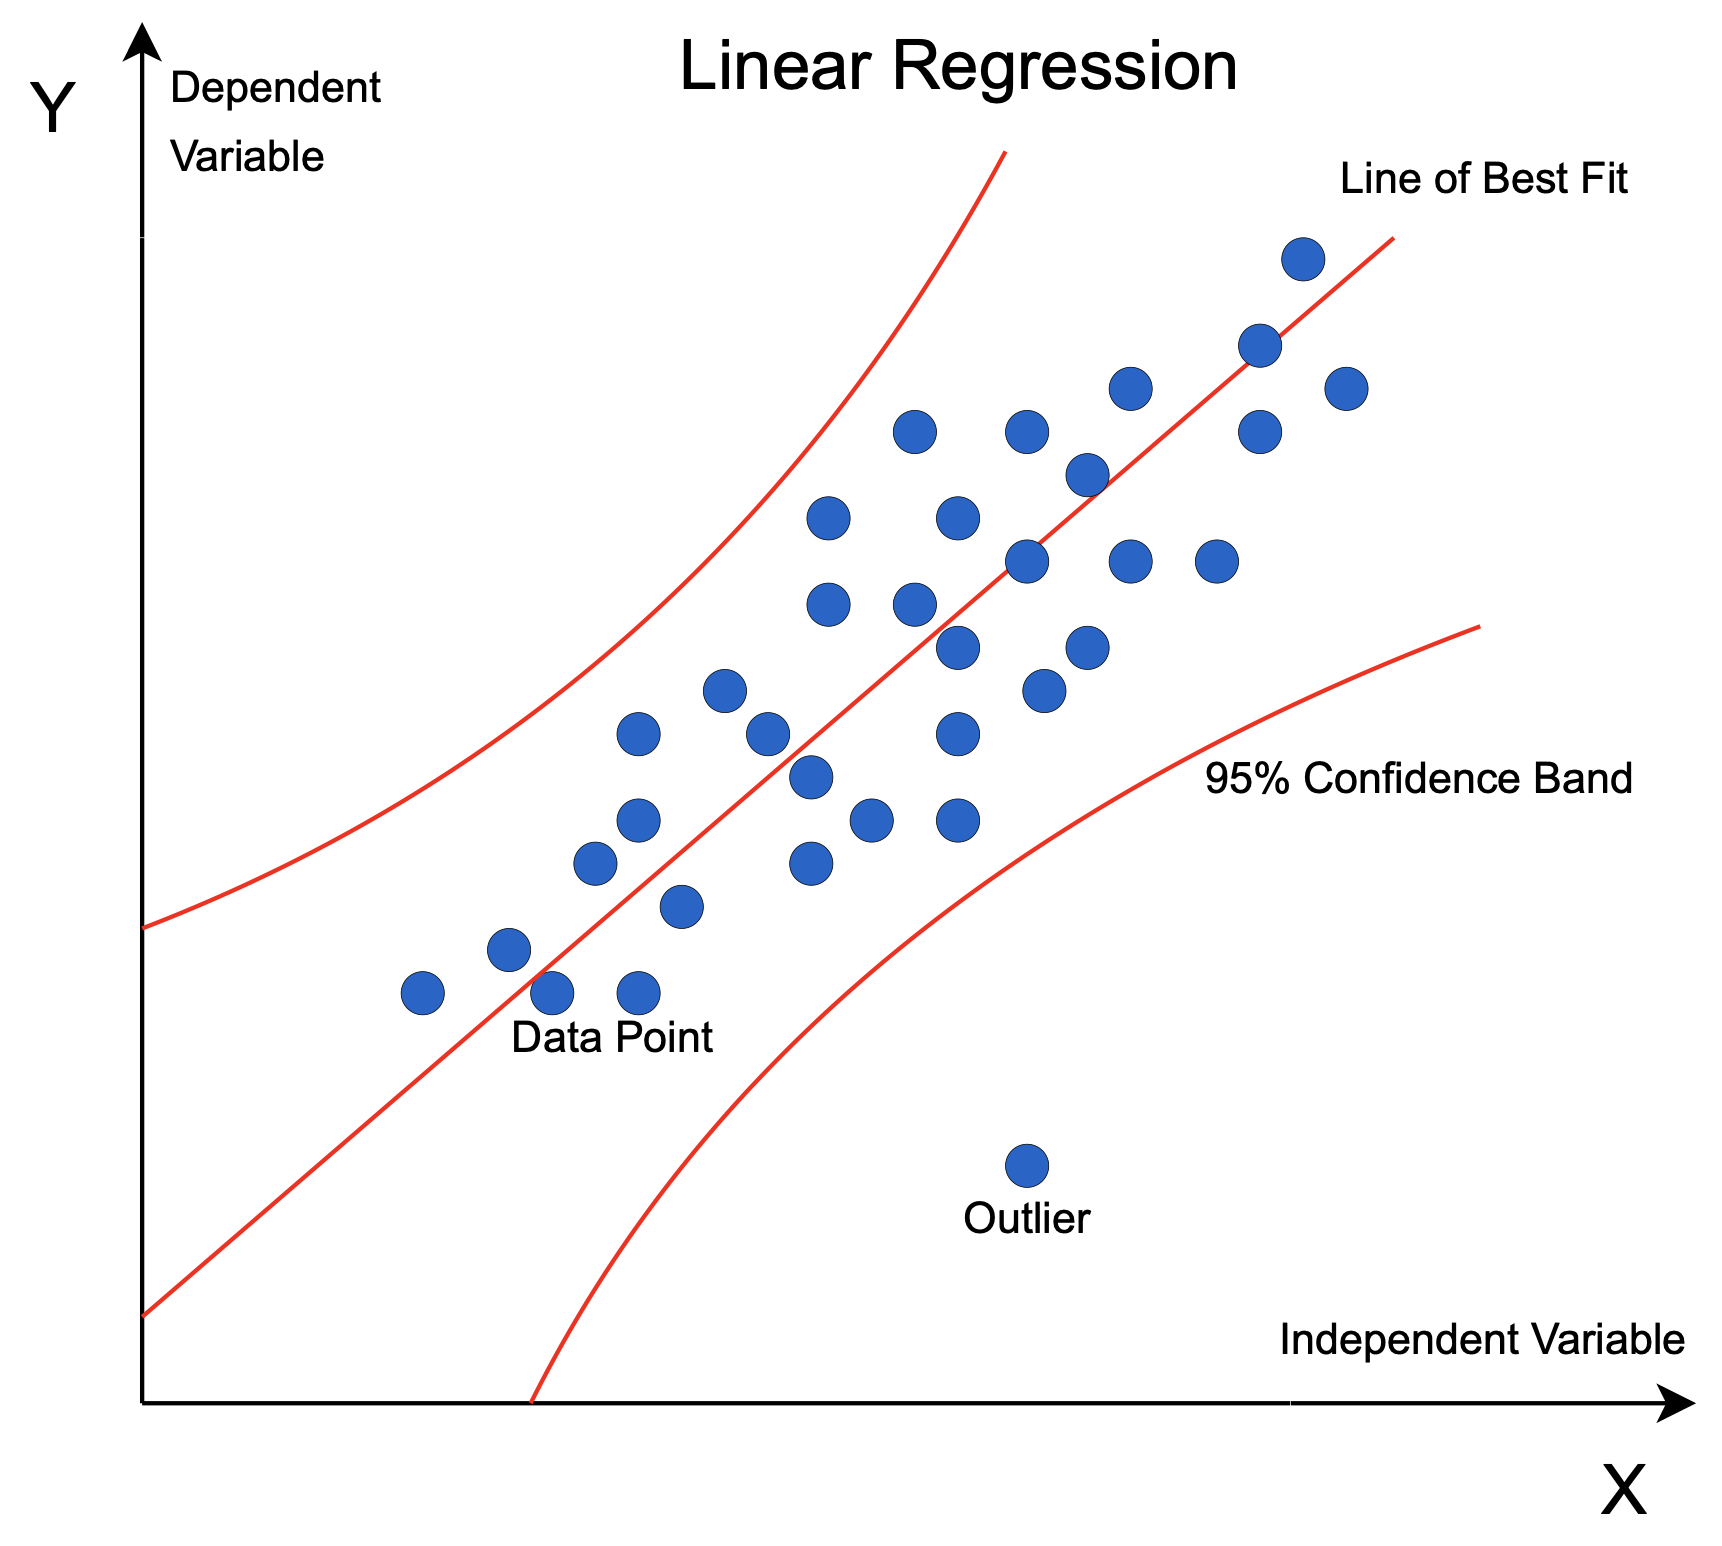
Finally, another issue that can occur is outliers, which are observations that are far from the rest of the data. These can influence the estimates and make them less reliable, so it is important to identify and deal with them in an appropriate way.
Despite these issues, regression remains a powerful tool that can be used to understand relationships between variables and make predictions. With the increasing availability of data, it is likely that its use will continue to grow in the future.
In conclusion, regression is a widely used technique for understanding relationships between variables and making predictions. It can be affected by linearity, nonlinearity, and outliers, but these issues can often be addressed with transformation techniques or by using different types of models.
We hope you enjoyed this introduction to regression. Stay tuned for more machine learning 101 blogs, coming soon!
If you have questions, join our growing Data Science community and we’ll happily help you!
Seamless deployment for data scientists and developers. Ploomber handles infrastructure so you focus on building. Secure and scalable—from personal projects to enterprise apps. Support for Streamlit, Dash, Docker, and AI-powered applications. Because life's too short for deployment headaches.

