Introduction
In data science, the challenge often extends beyond creating powerful analyses and models to making these insights accessible and actionable. Consider the scenarios where you’ve developed a sophisticated model in R, but your coworkers, who need to utilize these insights, are not familiar with R. Or perhaps, your team aims to integrate your work into other services written in different programming languages. This is where Plumber, an R package, becomes invaluable. Plumber transforms R capabilities into RESTful APIs, bridging the gap between data science and application development.
This post will guide you through creating RESTful APIs using Plumber, ensuring your R capabilities are accessible anytime, anywhere, and by anyone with an endpoint. We will also explore running the APIs locally, via Docker, and on Ploomber Cloud to meet your specific needs.
What is Plumber?
Plumber is an R package that enables data scientists to transform their R capabilities into deployable web services, creating RESTful APIs from R code. This allows other software systems to interact with R functions over HTTP. Key features include:
- Endpoint Definition: Uses special comments in R code to specify HTTP methods (GET, POST, PUT, DELETE) and define endpoints
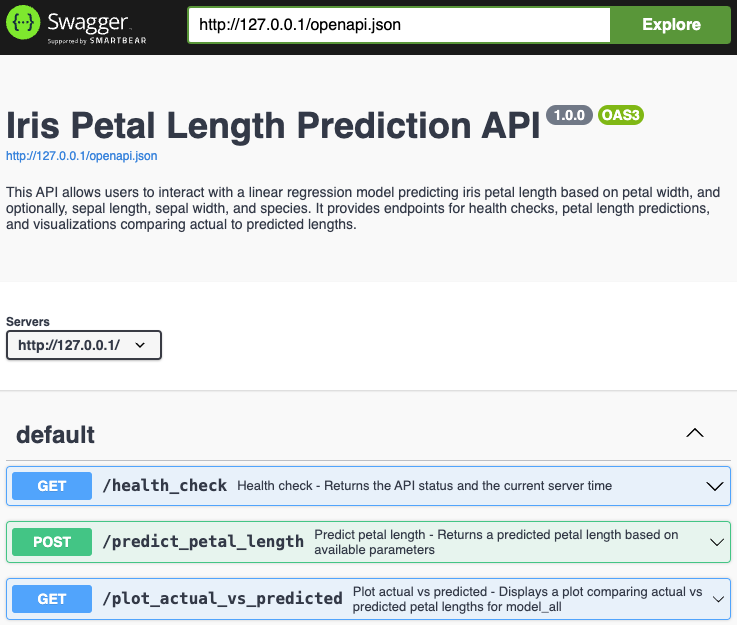
- Swagger Documentation: Automatically generates API documentation with a user-friendly interface for exploring and testing endpoints
- Data-Focused: Concentrates on providing APIs for data exchange and function invocation rather than building graphical user interfaces
- Versatile Integration: Ideal for data processing pipelines, machine learning model scoring, and integrating R with other systems
These features make Plumber essential for sharing R solutions and integrating them into broader systems, enhancing the utility and accessibility of R functionalities as robust web services.
Defining RESTful APIs with Plumber
To illustrate, consider deploying a linear regression analysis to predict an iris flower’s petal length. We will use a built-in dataset in R, the Iris dataset, which includes measurements from iris flowers of three species—Setosa, Versicolor, and Virginica. Each record contains four features: petal length, petal width, sepal length, and sepal width, along with the species of the flower.
We’ll set up three API endpoints in a single R script, which we’ll call plumber.R for this example. The three endpoints we will write are:
- Health Check: Confirms the API’s operational status
- Predict Petal Length: Predicts iris petal length using specific input parameters
- Plot Actual vs. Predicted: Displaying a plot that compares actual to predicted petal length
Step-by-Step Guide to Defining RESTful APIs
We begin by preparing the model we intend to expose through the APIs. Two linear models are trained using different parameters:
- model_petal_width: requires only petal width to predict petal length
- model_all: uses petal width, sepal length, sepal width, and the species for a more detailed prediction
We need to import library caret to split the data into training and testing sets. The testing set will be used later in implementing the third endpoint to display a plot.
Special comments in Plumber, starting with #*, define the API structure. In the code below, they are used to comment on what this API is about:
#* @apiTitle Iris Petal Length Prediction API
#* @apiDescription This API allows users to interact with a linear regression model predicting iris petal length from petal width.
#* It provides endpoints for health checks, predictions, and visualizations of the model fit.
library(caret)

# Prepare the model
dataset <- iris

# Split data into training and testing sets
train_index <- createDataPartition(iris$Petal.Length, p = 0.8, list = FALSE)
train_data <- iris[train_index, ]
test_data <- iris[-train_index, ]

# Train models
model_petal_width <- lm(Petal.Length ~ Petal.Width, data = train_data)
model_all <- lm(Petal.Length ~ Sepal.Length + Sepal.Width + Petal.Width + Species, data = train_data)
- Health Check (GET)
Now, let’s define the RESTful APIs. First, we want to check if the API is successfully up and running. The only thing we need to do is to add a special comment above our function, #* @get /health_check, to make the R function accessible via a GET request at the /health_check endpoint:
#* Health check - Returns the API status and the current server time
#* @get /health_check
function() {
  list(
    status = "The API is running",
    time = Sys.time()
  )
}
- Predict Petal Length (POST)
Next, we enable predictions of petal length with a POST request. This function requires a primary parameter, petal_width, and accepts optional parameters: sepal_length, sepal_width, and species. Depending on the availability and validity of these parameters, it chooses between two models—model_all for comprehensive input data, or model_petal_width when only petal width is available.
Parameters are defined using the syntax #* @param <parameter_name> <Type>: <Description>. We make this function accessible via a POST request at the /predict_petal_length endpoint:
#* Predict petal length - Returns a predicted petal length based on available parameters
#* @param petal_width Numeric: Width of the petal (required)
#* @param sepal_length Numeric: Length of the sepal
#* @param sepal_width Numeric: Width of the sepal
#* @param species Character: Species of the iris (setosa, versicolor, virginica)
#* @post /predict_petal_length
function(petal_width, sepal_length = NA, sepal_width = NA, species = NA) {
  # Check if the required parameter petal_width is provided
  if (missing(petal_width) || !is.numeric(as.numeric(petal_width))) {
    return(list(error = "Invalid or missing parameter: petal_width"))
  }
  # Check which parameters are provided and create the input data frame accordingly
  if (!is.na(sepal_length) && !is.na(sepal_width) && !is.na(species)) {
    input_data <- data.frame(
      Sepal.Length = as.numeric(sepal_length),
      Sepal.Width = as.numeric(sepal_width),
      Petal.Width = as.numeric(petal_width),
      Species = as.factor(species)
    )
    prediction <- predict(model_all, input_data)
  } else {
    input_data <- data.frame(Petal.Width = as.numeric(petal_width))
    prediction <- predict(model_petal_width, input_data)
  }

  list(petal_width = petal_width, predicted_petal_length = prediction)
}
- Plot Actual vs. Predicted Lengths (GET)
Lastly, we add a GET request endpoint at /plot_actual_vs_predicted to display a plot comparing actual lengths with predicted lengths using model_all on the testing dataset:
#* Plot Actual vs Predicted - Displays a plot comparing actual vs predicted petal lengths for model_all
#* @serializer png
#* @get /plot_actual_vs_predicted
function() {
  predictions <- predict(model_all, test_data)
  plot(test_data$Petal.Length, predictions,
    xlab = "Actual Petal Length", ylab = "Predicted Petal Length",
    main = "Actual vs Predicted Petal Length"
  )
  abline(0, 1, col = "red") # 1:1 line
}
Now that we’ve defined the endpoints, let’s explore how to run and access the APIs.
Running the REST APIs
For development and testing, running your APIs locally or via Docker offers a practical approach. First, let’s run the APIs on your localhost.
Localhost
This example uses RStudio and Visual Studio Code on a Mac environment.
library(plumber)
pr <- plumb("plumber.R")    # Load your Plumber API definition
pr$run(port = 80, host = "0.0.0.0") # Run the API on localhost
Save this script as main.R and run Rscript main.R in your terminal. This will activate your Plumber API on localhost, and you’ll be able to access your Swagger Docs at http://127.0.0.1:80/__docs__/. By default, when you run the API, Plumber serves the Swagger UI at the /__docs__/ endpoint. This provides a user-friendly interface to interact with your API, allowing you to test API endpoints directly from the browser:

And we can access these endpoints using the following commands:
curl -X 'GET' 'http://127.0.0.1/health_check'
curl -X 'POST' 'http://127.0.0.1/predict_petal_length' -d 'petal_width=10'
curl -X 'POST' 'http://127.0.0.1/predict_petal_length' -d "petal_width=1.2" -d "sepal_length=3.5" -d "sepal_width=2.1" -d "species=setosa"
curl -X 'POST' 'http://127.0.0.1/predict_petal_length' -d '{"petal_width": 1.2, "sepal_length": 3.5, "sepal_width": 2.1, "species": "setosa"}' -H "Content-Type: application/json"
curl -X 'GET' 'http://127.0.0.1/plot_actual_vs_predicted' --output plot.png
For example, the output would look like:
curl -X 'GET' 'http://127.0.0.1/health_check'
{"status":["The API is running"],"time":["2024-07-31 16:53:23"]}

curl -X 'POST' 'http://127.0.0.1/predict_petal_length' -d 'petal_width=10'
{"petal_width":["10"],"predicted_petal_length":[23.383]}

curl -X 'POST' 'http://127.0.0.1/predict_petal_length' -d "petal_width=1.2" -d "sepal_length=3.5" -d "sepal_width=2.1" -d "species=setosa"
{"petal_width":["1.2"],"predicted_petal_length":[1.2825]}

curl -X 'GET' 'http://127.0.0.1/plot_actual_vs_predicted' --output plot.png
  % Total    % Received % Xferd  Average Speed   Time    Time     Time  Current
                                 Dload  Upload   Total   Spent    Left  Speed
100 28262  100 28262    0     0  1017k      0 --:--:-- --:--:-- --:--:-- 1022k
The third command saves a PNG file named plot.png in your working directory.
Docker
For Docker deployment, create a Dockerfile:
FROM rstudio/plumber
WORKDIR /app
COPY . /app
RUN R -e "install.packages('caret', repos='http://cran.rstudio.com/')"
EXPOSE 80
ENTRYPOINT ["Rscript", "main.R"]
Build and run your Docker container using the following commands:
docker build -t plumber-api .
docker run --rm -p 80:80 plumber-api
You can access the endpoints in the same way as above.
Deployment on Ploomber Cloud
To ensure your API remains accessible regardless of the status of your local machine, consider deploying it on Ploomber Cloud using the Docker option. If you haven’t created an account yet, please sign up here. Ploomber Cloud offers not just deployment solutions but also robust security features such as password protection and application secrets.
Note: Docker deployment and password protection are available exclusively to Pro, Teams, and Enterprise users. Start your 10-day free trial here.
Once you have your Pro or higher-tier account and have prepared your code and Dockerfile, following the sections Defining RESTful APIs with Plumber and Docker, you are ready to deploy your application on Ploomber Cloud!
Ploomber Cloud supports two deployment methods: (1) Graphical User Interface, and (2) Command Line Interface. Let’s explore both.
Graphical User Interface (GUI)
First, log into your Ploomber Cloud account.
Click the NEW button:

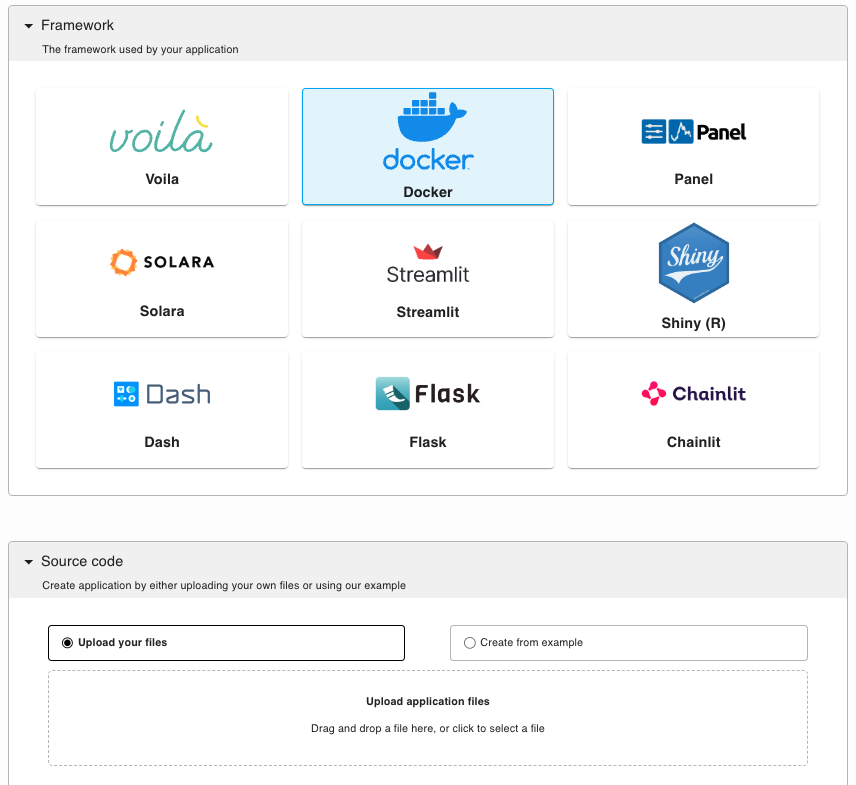
Select the Docker option, and upload your code as a zip file in the source code section:

Once its deployment is successfully completed, you can access your Swagger Docs at this link: https://<id>.ploomber.app/__docs__/. Additionally, you can interact with your endpoints using the following terminal commands:
curl -X 'GET' 'https://<id>.ploomber.app/health_check'
curl -X 'POST' 'https://<id>.ploomber.app/predict_petal_length' -d 'petal_width=10'
curl -X 'POST' 'https://<id>.ploomber.app/predict_petal_length' -d "petal_width=1.2" -d "sepal_length=3.5" -d "sepal_width=2.1" -d "species=setosa"
curl -X 'GET' 'https://<id>.ploomber.app/plot_actual_vs_predicted' --output plot.png
Note: For a different Docker-based deployment example using FastAPI, refer to this link.
Command Line Interface (CLI)
If you haven’t installed ploomber-cloud, run:
pip install ploomber-cloud
Then, set your API key following to this documentation.
ploomber-cloud key YOURKEY
Navigate to your project directory where your Dockerfile is located and initialize the project.
cd <project-name>
ploomber-cloud init
Confirm the inferred project type (Docker) when prompted:
(base) ➜  ploomber-cloud init
Initializing new project...
Inferred project type: 'docker'
Is this correct? [y/N]: y
Your app '<id>' has been configured successfully!
To configure resources for this project, run 'ploomber-cloud resources' or to deploy with default configurations, run 'ploomber-cloud deploy'
Now, deploy your application:
ploomber-cloud deploy
Monitor the deployment at the provided URL:
(base) ➜  ploomber-cloud deploy                 ✭ ✱
Compressing app...
Adding Dockerfile...
Adding README.md...
Adding main.R...
Ignoring file: ploomber-cloud.json
Adding plot.png...
Adding plumber.R...
App compressed successfully!
Deploying project with id: <id>
The deployment process started! Track its status at: https://www.platform.ploomber.io/applications/<id>/<job_id>
Wait until your application is successfully deployed, then explore your Swagger Docs or endpoints with the same as above.
Conclusion
In this guide, we have demonstrated how to create REST APIs with the Plumber package, effectively transforming diverse data science work conducted in R into deployable web services. This method significantly extends the reach of your data science projects, making them more accessible and easier to integrate across various applications. We also explored running these APIs locally and using Docker for testing, as well as deploying them on Ploomber Cloud. Adopting these tools will not only enhance the usability of your data science solutions but also make them invaluable resources for your team and organization.


