When analyzing data in a Jupyter notebook, I unconsciously memorize “rules of thumb” to determine if my results are correct. For example, I might print some summary statistics and become skeptical of some outputs if they deviate too much from what I’ve seen historically. For more complex analysis, I often create diagnostic plots (e.g. a histogram) and check them whenever new data arrives.
I’ve done this semi-manual testing for years, and while talking to other data scientists, I realized this is common; yet, there aren’t tools available to streamline the process. So I started to ask myself if we could automate this testing process. The solution became clear to me while talking to a frontend developer, who introduced me to the idea of snapshot testing.
Imagine a frontend developer authoring a UI using HTML, CSS, and Javascript. How can the developer test whether a user interface is correct? You could say that some user interfaces are better than others (if they’re easier to use), but the correctness argument does not apply here. So our best shot is to use our previous implementation as a benchmark. For example, we might raise an error if the position of a button has changed unexpectedly.
We can apply the same idea to notebook testing. Imagine you have a notebook that cleans an input dataset, computes some metric (e.g. percentage of NAs on a given column), and then stores the clean dataset for further analysis:
# cell 1
df = load_data()

# cell 2-10
# code for cleaning df

# cell 11
print(compute_metric(df))

# cell 12
plot_data(df)

# cell 13
df.to_csv('output/clean.csv')
Let’s say we run this notebook today. Then, a week goes by, we run the notebook and obtain the same results. Then, two weeks go by, we run the notebook and realize that our metric looks very different from the previous two values.
| Metric value | Status | |
|---|---|---|
| week 1 | 0.81 | OK |
| Week 2 | 0.83 | OK |
| Week 3 | 0.7 | ??? |
We don’t know what’s the cause, but we know something occurred. So we proceed to analyze the situation: it could be that the input data changed, or it could be that our code contains some errors. Whatever that is, it’s great that we caught this so we can investigate further.
The snapshot testing aims to facilitate this process: we’ll automatically benchmark the notebook’s outputs to detect potential issues.
nbsnapshotTo the best of our knowledge, nbsnapshot is the first implementation of Snapshot Testing for Jupyter notebooks, and we’re stoked to release it!
The idea is simple, each time we run our notebook, we record the outputs we want to benchmark. Then, once we have at least two historical records, we start comparing new values with historical ones. Finally, we show an error if the new value deviates (by default, it uses three standard deviations as a threshold) from the recorded values. Let’s see a complete example.
First, let’s import a few packages and declare two functions that we’ll use:
import json
from pathlib import Path
import urllib.request

import numpy as np
import pandas as pd
import matplotlib.pyplot as plt

from nbsnapshot import compare
from nbsnapshot.exceptions import SnapshotTestFailure

plt.style.use('ggplot')
plt.rcParams['figure.figsize'] = (12, 6)
plt.rcParams['font.size'] = 18

def create_fake_history(mean):
    """Creates a fake notebook history
    """
    history = [dict(metric=x) for x in np.random.normal(loc=mean, size=10)]
    _ = Path('constant.json').write_text(json.dumps(history))

def plot_history(title=None):
    """Plots records stored in notebook history
    """
    history = pd.read_json('constant.json')
    history['metric'].plot(kind='density', title=title)
Download a sample notebook:
URL = 'https://raw.githubusercontent.com/ploomber/nbsnapshot/main/examples/constant.ipynb'
_ = urllib.request.urlretrieve(URL, 'constant.ipynb')
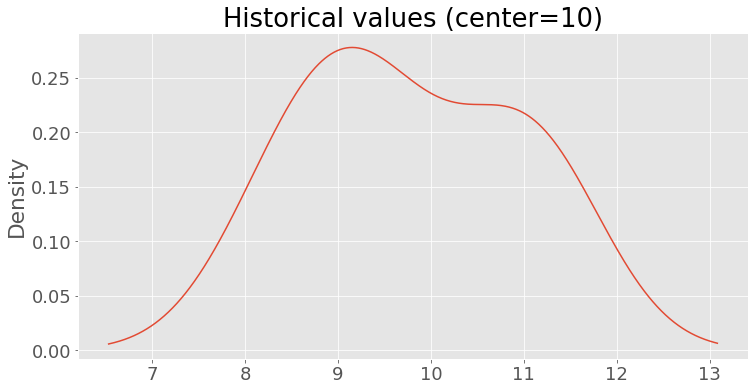
Let’s create a fake historical file to simulate that we ran a notebook (with a single cell) 10 times. To generate a fake output, we draw values from a normal distribution centered at 10 (and a standard deviation of 1):
create_fake_history(mean=10)
plot_history(title='Historical values (center=10)')
Console output: (1/1):
Let’s run the sample notebook (constant.ipynb). This notebook only contains a cell that prints the number 10. Since this number is within the boundaries of our fake history, the test passes:
try:
    compare.main('constant.ipynb')
except SnapshotTestFailure as e:
    print(e)
Console output: (1/1):
Testing: 'metric' - OK!
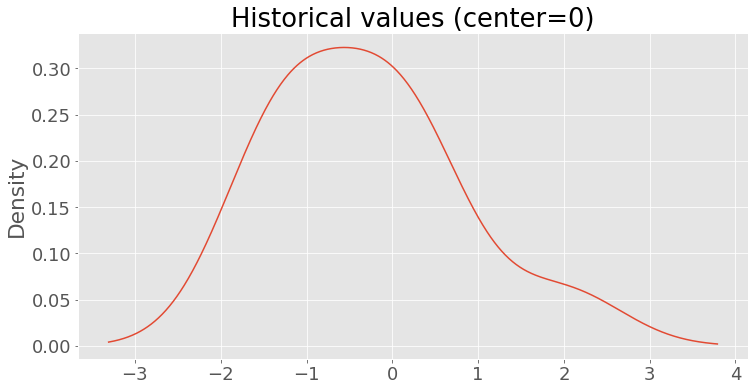
Now, let’s overwrite the existing history and replace it with numbers drawn from a normal distribution centered at 0:
create_fake_history(mean=0)
plot_history(title='Historical values (center=0)')
Console output: (1/1):
Rerun the notebook. This time, the value in the notebook (10) deviates too much from the historical records. Hence, the test fails:
try:
    compare.main('constant.ipynb')
except SnapshotTestFailure as e:
    print(e)
Console output: (1/2):
Testing 'metric' - FAIL! Value is too high (10), expected one between -3.56 and 2.95
Console output: (2/2):
Some tests failed.
That’s it! This simple approach lets us detect issues in our notebooks without extra effort!
Here are two important use cases where snapshot testing is instrumental.
Monitoring data quality
Suppose you have a notebook that ingests data every week. You can use snapshot testing to measure the quality of the ingested data and throw an error if it suddenly degrades. For example, you might have a cell that prints the percentage of NAs in a column named age:
| % of NAs in “age” column | Status | |
|---|---|---|
| Monday | 1% | OK |
| Tuesday | 1.2% | OK |
| Wednesday | 1% | OK |
| Thursday | 0.9% | OK |
| Friday | 5% | ERROR |
You can see in the table above that from Monday to Thursday, the percentage of NAs deviated a little from 1%, but on Friday, it skyrocketed to 5%, so something must have happened.
Another example test would be to count the number of observations in the age column with negative values. This test will allow you to detect whenever corrupted values such as -2, or -10 enter the notebook.
Monitoring model training performance
Imagine you have a notebook that uses a training dataset as input and outputs a trained model. You may use snapshot testing to throw an error if the model performance metric (e.g. accuracy) degrades suddenly. Snapshot tests can help you detect problems such as corrupted data, model misconfiguration, or data leakage.
For example, let’s say you’ve been training models, and suddenly, the model accuracy drops:
| Experiment | Accuracy | Status |
|---|---|---|
| 1 | 0.80 | OK |
| 2 | 0.82 | OK |
| 3 | 0.79 | OK |
| 4 | 0.81 | OK |
| 5 | 0.70 | ERROR |
Knowing about this sudden change will allow you to investigate further to find out what happened.
To test effectively, we recommend you implement snapshot testing in a Continuous Integration manner; this implies running the tests whenever you modify the source code. For example, you might use GitHub Actions and run the following command on each commit to your project:
nbsnapshot test notebook.ipynb
This command will run the test whenever you push changes to your repository.
nbsnapshot supports checking multiple cells in the same notebook; however, consider that the more tests you have, the higher the chance that any of your checks will fail due to a false positive. So we recommend only testing a couple of essential metrics. In cases where your outputs are deterministic, you can check as many cells as you want.
Snapshot Testing requires the historical results to be updated manually. For example, let’s say you’ve been training a model and the historical accuracy has been around 0.80 for the last ten experiments; then, you realize that those experiments had data leakage. After fixing the problem, the accuracy drops to 0.70. Hence, if you run a snapshot test, it will fail. However, in this case, the error is in the historical records, so you should delete them and replace them with the new value of 0.70. Doing this clean-up requires extra effort, but it’s worth the time savings that snapshot testing provides in the long run.
In this blog post, we introduced Snapshot Testing for Jupyter notebooks, a simple idea that can greatly improve the workflow of Data Scientists. Please give nbsnapshot a try. The library is new so let us know if you have any feature requests! A perfect complement for nbsnapshot is Ploomber, our open-source framework for orchestrating notebook-based pipelines.
If you want keep up-to-date, follow us on Twitter, LinkedIn, or subscribe to our newsletter. If you have feedback, send us a message on Slack!
Seamless deployment for data scientists and developers. Ploomber handles infrastructure so you focus on building. Secure and scalable—from personal projects to enterprise apps. Support for Streamlit, Dash, Docker, and AI-powered applications. Because life's too short for deployment headaches.