


In this tutorial, I’ll show you how to use VSCode to debug a Streamlit app. We’ll go from the basics of configuration to setting breakpoints and exploring variables.
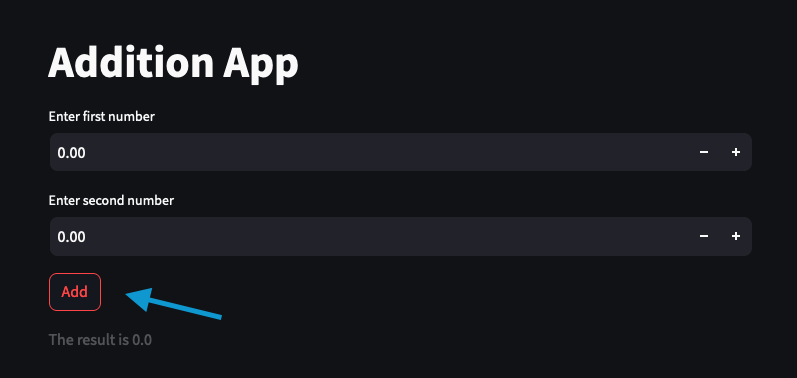
First, let’s write a simple Streamlit app that adds two numbers:
# store this as app.py
import streamlit as st

st.title("Addition App")

num1 = st.number_input("Enter first number")
num2 = st.number_input("Enter second number")

if st.button("Add"):
    result = num1 + num2
    st.write(f"The result is {result}")
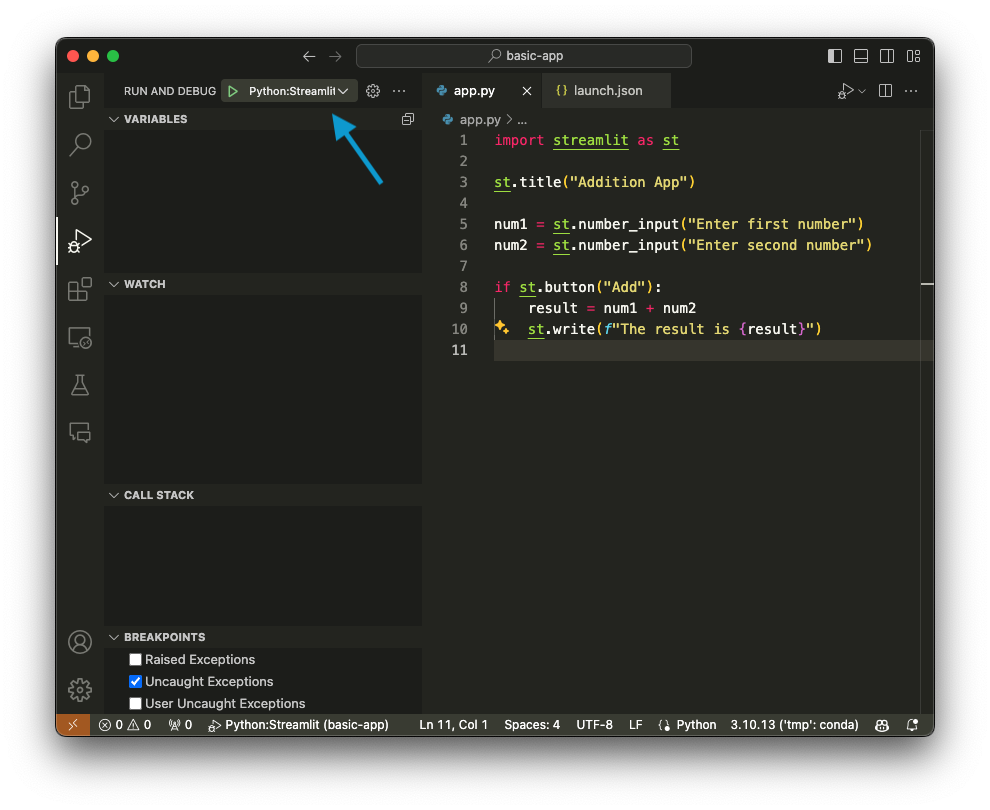
Now, open VSCode and click on the “Run and Debug” button (see image below):
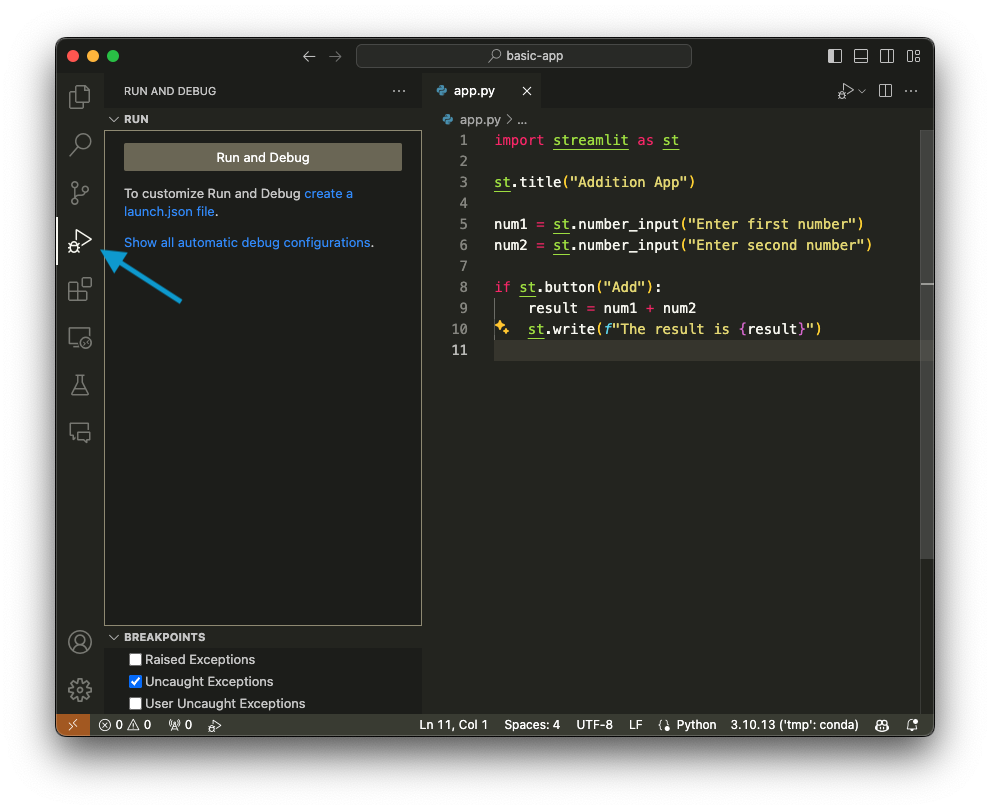
You’ll see:
To customize Run and Debug create a launch.json file.
Click on:
create a launch.json file.
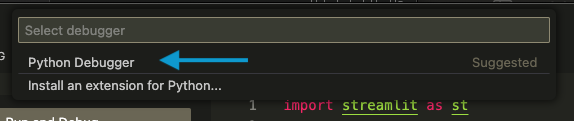
Then, click on Python debugger:
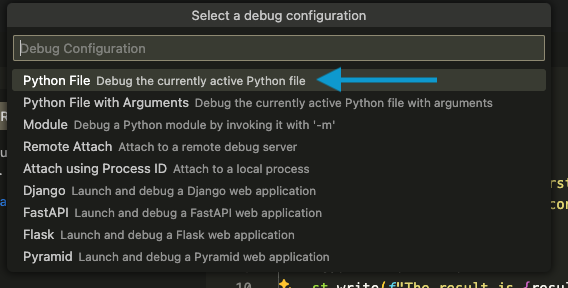
Then, click on Python File:
A launch.json file will open. Delete the contents, replace them with the following:
{
    "version": "0.2.0",
    "configurations": [
        {
            "name": "Python:Streamlit",
            "type": "debugpy",
            "request": "launch",
            "module": "streamlit",
            "args": [
                "run",
                "${file}",
                "--server.port",
                "2000"
            ]
        }
    ]
}
…and save the file. It should look like this:
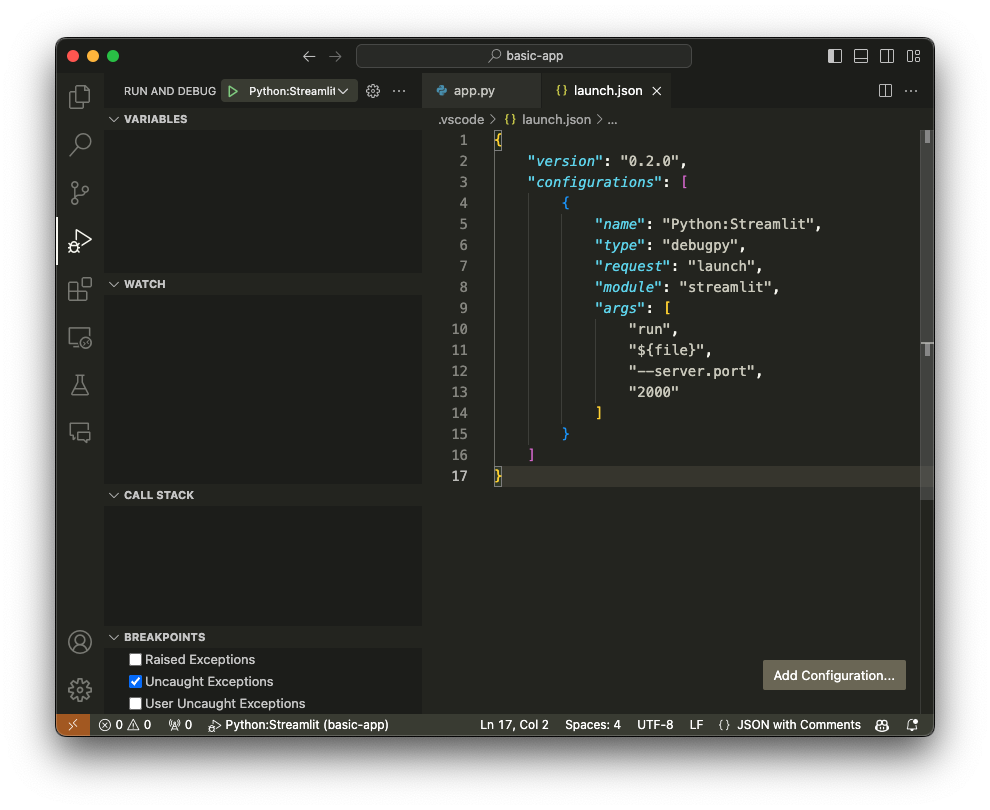
That’s it! The debugger is now configured.
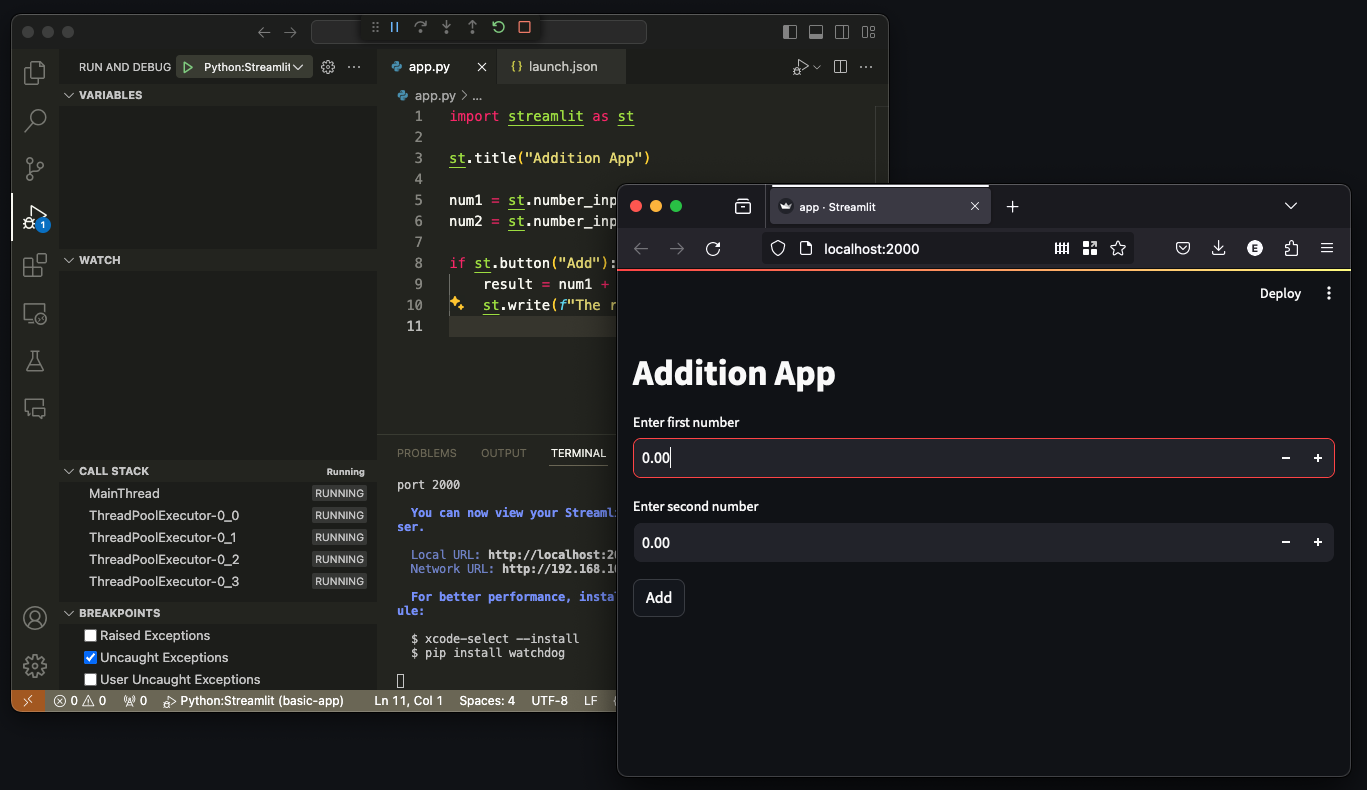
Now, open the app.py file. On the left side, you’ll see a new button that says Python:Streamlit:
This means that the debugger has been configured successfully. If you click on it, you’ll see that your app starts and the CALL STACK section on the left populates:
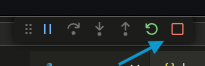
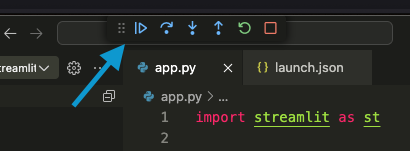
You’ll see that a new bar appears at the top. To exit the debugger, click on the red square:
Breakpoints are the fundamental element of debugging. When you set a breakpoint in a certain line (and such line runs), execution will halt, allowing you to explore the state of your application.
Here’s how to set a breakpoint:
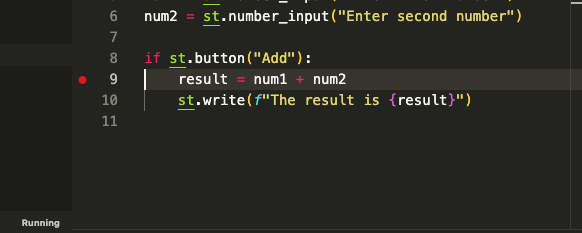
Let’s use our example app. We’ll set a breakpoint in line 9, which executes when we click the button. This is how it’ll look like after setting the breakpoint:
Now, go to your Streamlit app and click on the Add button:
Then, go back to VSCode, and you’ll see that line 9 will have a yellow background:
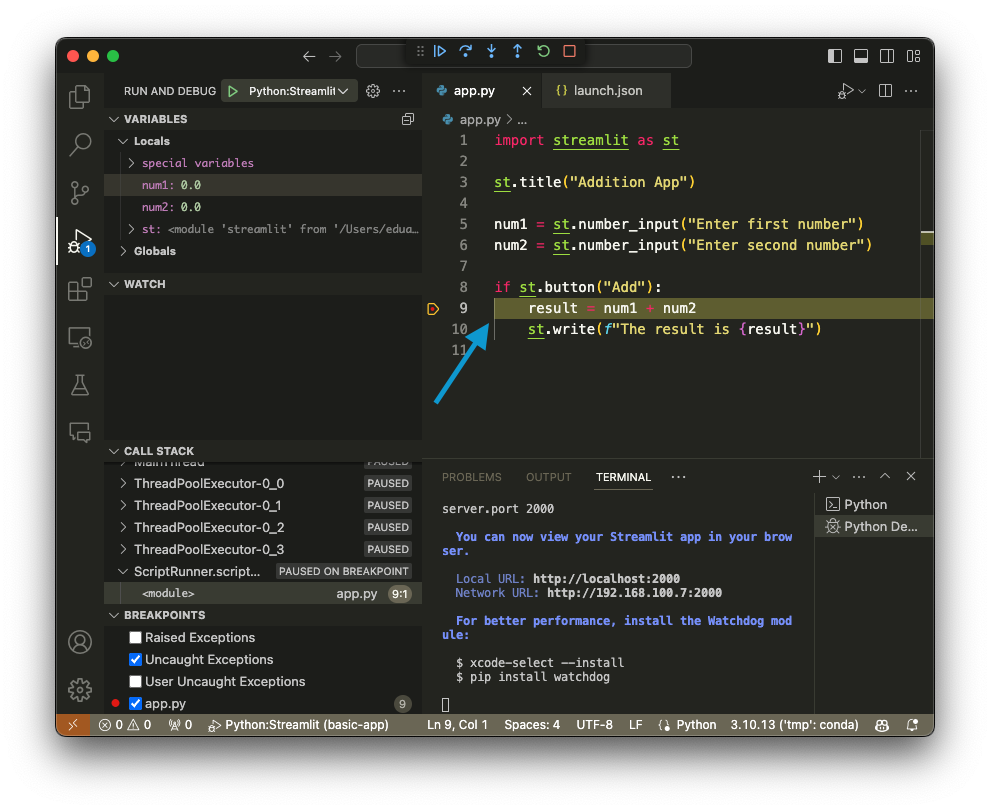
Furthermore, on your left side, you’ll see the values of the variables in your app:
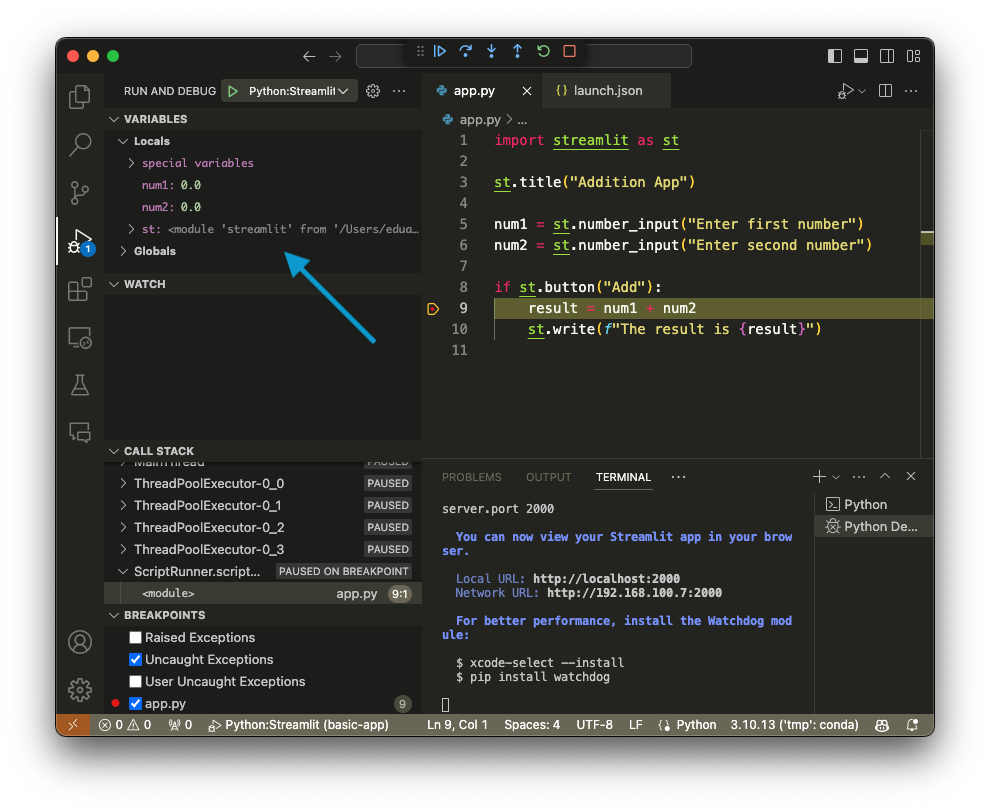
Execution has been stopped; now, you can debug your app. You can move to the DEBUG CONSOLE, which will allow you to explore the variables, set new values, and run Python code:
Once you have finished debugging, you can click on the first button in the top bar to continue execution.
The following video shows the entire debugging session:
That’s it! Note that we’ve only scratched the surface of VSCode’s debugging features. So, experiment with it to learn more!
Once your app is ready, deploy it to our platform! We offer several features to help you build a professional Streamlit application: authentication, analytics, powerful CPUs, GPUs, secure API key storage, deployment from GitHub, custom domains, etc.
Seamless deployment for data scientists and developers. Ploomber handles infrastructure so you focus on building. Secure and scalable—from personal projects to enterprise apps. Support for Streamlit, Dash, Docker, and AI-powered applications. Because life's too short for deployment headaches.

