Introduction
Streamlit is an open-sourced Python framework for building interactive data applications. It requires little to no front-end experience and can be a great tool for displaying interactive data visualizations in your web applications. A common method for creating Streamlit applications is to have a static data source, typically in the form of a dataframe, and then plotting and displaying whatever data you need. However, what if you have a data source that is constantly updating? Can we still use Streamlit to display live, accurate information? Well, we can use Streamlit’s compatibility with popular relational databases such as PostgreSQL, MySQL, Sqlite, and others to do so.
In this blog post, we will dive into creating a PostgreSQL database, uploading data to the database, interacting with the database from Streamlit, and deploying the Streamlit application on Ploomber Cloud.
Demo - Creating a Live Streamlit App
Before we get started, here is a preview of what we will be building. The full demo code can be found here.

The application is a simple dashboard for the classic Iris dataset. This dashboard is special because we’ve made it possible for users to insert data into our database via a form. After a user submits the form on the sidebar, a query is performed that uploads the data to our database which updates our other dashboard elements. This feature was designed to emulate what collecting live data would look like.
Now, let’s get started on making the app!
Creating a PostgreSQL Database
If you already have a database set up, feel free to skip this step. If you want to or are currently using a different database such as MySQL or SQLite, all the steps are identical aside from a few differences. All we have to do is replace our PostgreSQL URI’s with the URI’s corresponding to the other database. Check out this page for more details.
For the purpose of this blog, we can create a PostgreSQL database using Neon. Neon is a serverless Postgres database platform that allows developers to create a database in just a few clicks. A free tier with 0.5 GB of storage is available. After creating an account, you should be prompted to create a project. Enter the project name, the Postgres version you want, the database name, and your region.
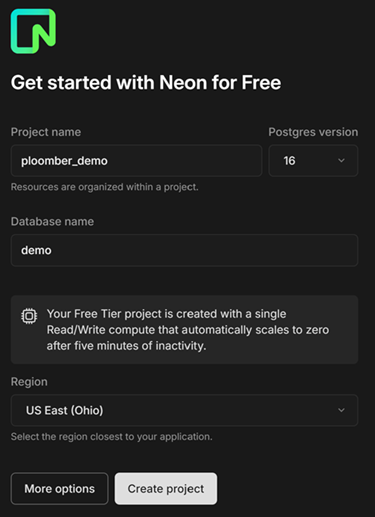
After creating the project, you will be redirected to your project dashboard. Inside the dashboard, there is an element labeled Connection string. The connection string, also known as a URI, is an identifier that contains all the parameters required to connect to your database. We will need the URI later.
Upload Data to PostgreSQL Database
Now that we have created a database, there are many ways to upload data to it. In this blog, we will be using SQLAlchemy, an open-source Python package that refers to itself as the “database toolkit for Python”. The process is pretty easy, just follow these steps:
- Make sure the following Python packages are installed on your environment:
streamlit
SQLAlchemy
psycopg2-binary
ucimlrepo
To do this, create a file called requirements.txt with those package names. To install all the packages in this text file we just created, run:
pip install -r requirements.txt
- Create a Python script, call it
app.py.
We will be developing our Streamlit application in this file.
- Add the following import statements to
app.py.
import streamlit as st
from sqlalchemy import text, create_engine
from os import environ
from ucimlrepo import fetch_ucirepo
- Create an
upload_datafunction.
We will define a function called upload_data which takes in the database URI as a parameter, imports the Iris dataset from the UCI ML repository, connects to the database, and uploads the dataset as a table using Pandas' to_sql function.
def upload_data(DB_URI):
    # Loading in iris dataset
    iris = fetch_ucirepo(name="Iris")
    iris_df = iris.data.original
    iris_df.reset_index(drop=True)

    # Establishes a connection to the database
    engine = create_engine(DB_URI)
    with engine.connect() as engine_conn:
        iris_df.to_sql(name="iris", con=engine_conn, if_exists='replace', index=False)
        print("Data successfully uploaded.")
    engine.dispose()
- Call the
upload_datafunction using your DB_URI.
upload_data("YOUR DB_URI")
Now, you can run app.py from whatever IDE you are using, or through the terminal using
python app.py
Your data should now be uploaded to your database!
Creating the Streamlit Application
Streamlit is designed to make it easy for users to create and share custom data web applications. There is publicly available documentation which users can reference to modify the app for their purpose. In this section, I will implement some basic web features and how to interact with our PostgreSQL database in Streamlit. We will look at how to run the app locally and in a later section, we will deploy our app to the Ploomber Cloud.
To recap, the application that we are making will have the following:
- An established connection to our PostgreSQL database
- Display metrics such as average petal length from our database.
- Interactive scatter-plot that allows the users to pick the variables they want to visualize
- A data table
- A sidebar form that allows users to insert data to the table in our database.
- A reset button to remove all user-inputted data.
Before we get started, since we want our updates to save to our database, we want to avoid calling upload_data every time our app is refreshed. Remove the following function call that we added in the previous section.
upload_data("YOUR DB_URI")
Now, let’s move on to building the app!
- Connecting Streamlit App to Postgres
In the following lines of code, we use a boolean variable cloud to represent whether we are deploying the app to Ploomber Cloud or not. Since we are not doing that yet, just replace YOUR DB_URI with your database URI. Then, we establish a connection between our streamlit app and our database by using the built-in Streamlit connection method. The method takes in a name, type, url, and other optional parameters and returns a database connection object. We can then use this connection to perform operations on our database. In this case, we query the iris table on our database into a variable called iris_data.
cloud = False
DB_URI = environ["DB_URI"] if cloud else "YOUR DB_URI"
conn_st = st.connection(name="postgres", type='sql', url = DB_URI)
iris_data = conn_st.query("SELECT * FROM iris")
- Creating Data Elements
In our Iris dashboard, let’s display some summary metrics about the irises. We first use the st.columns method to put all our metrics onto one row. Then, we use the st.metric method to create metrics for the mean sepal length, sepal width, petal length, and petal width.
# Display Metrics
col1, col2, col3, col4 = st.columns(4)

with col1:
    st.metric("Average Sepal Length (cm)", round(iris_data["sepal length"].mean(), 2))
with col2:
    st.metric("Average Sepal Width (cm)", round(iris_data["sepal width"].mean(), 2))
with col3:
    st.metric("Average Petal Length (cm)", round(iris_data["petal length"].mean(), 2))
with col4:
    st.metric("Average Petal Width (cm)", round(iris_data["petal width"].mean(), 2))

Next, let’s make a scatter plot to visualize the correlations between our width and length variables. We first create some selectbox elements so that users can select which quantitative variables they want to look at. Next, we use the st.scatterchart method to create the plot itself.
# Displays Scatterplot
st.header("Scatter Plot")

c1, c2 = st.columns(2)

with c1:
    x = st.selectbox("Select X-Variable", options=iris_data.select_dtypes("number").columns, index=0)
with c2:
    y = st.selectbox("Select Y-Variable", options=iris_data.select_dtypes("number").columns, index=1)

scatter_chart = st.scatter_chart(iris_data, x=x, y=y, size=40, color='class')

Lastly, let’s display the entire iris table as well, so we can clearly see the table getting updated.
# Displays Dataframe
st.dataframe(iris_data, use_container_width=True)

- Inserting data into the database.
As previously mentioned, we will be creating a sidebar that allows users to insert new instances of the iris data into our database. The goal of this feature is to emulate live data, in this case, we are collecting new iris datapoints. To do this, we can create a form in Streamlit that lets users submit new data points. As soon as they do, the metrics, scatterplot, and dataframe will update automatically to reflect the new data. Additionally, we will create a reset button that resets the data in our database to the original dataset.
# Creates sidebar to add data
with st.sidebar:
    reset = st.button("Reset Data")
    st.header("Add Iris Data")
    st.subheader("After submitting, a query is executed that inserts a new datapoint to the 'iris' table in our database.")
    with st.form(key='new_data'):
        sepal_length = st.text_input(label="Sepal Length (cm)", key=1)
        sepal_width = st.text_input(label="Sepal Width (cm)", key=2)
        petal_length = st.text_input(label="Petal Length (cm)", key=3)
        petal_width = st.text_input(label="Petal Width (cm)", key=4)
        iris_class = st.selectbox(label="Iris Class (cm)", key=5, options=iris_data["class"].unique())
        submit = st.form_submit_button('Add')
If the reset button is clicked, we call our upload_data function again, which loads in the iris dataset and replaces the table in our database with the original. We use the st.cache_data.clear method to tell Streamlit to reload the data rather than using cached data. We then query the new data back into our iris_data variable.
# Replaces dataset in database with original
if reset:
    upload_data(DB_URI)
    st.cache_data.clear()
    st.rerun()
After submitting the form, we use the connection session, create an SQL query to insert the new data into the iris table, clear the cache, and rerun our application.
# Inserts data into table
if submit:
    with conn_st.session as s:
        new_data = (sepal_length, sepal_width, petal_length, petal_width, iris_class)
        q = """
                INSERT INTO iris ("sepal length", "sepal width", "petal length", "petal width", "class")
                VALUES (:sepal_length, :sepal_width, :petal_length, :petal_width, :iris_class)
            """
        s.execute(text(q), {
            'sepal_length': sepal_length,
            'sepal_width': sepal_width,
            'petal_length': petal_length,
            'petal_width': petal_width,
            'iris_class': iris_class
        })
        s.commit()
    # Clears the cached data so that streamlit fetches new data when updated.
    st.cache_data.clear()
    st.rerun()
To illustrate how this works, suppose that we find a versicolor iris with a sepal length of 11, sepal width of 6.9, petal length of 4.2, and petal width of 5. We can fill in the respective fields in our web application and submit. The app then adds this datapoint to our database table and the data features on our application will update automatically with the new data.
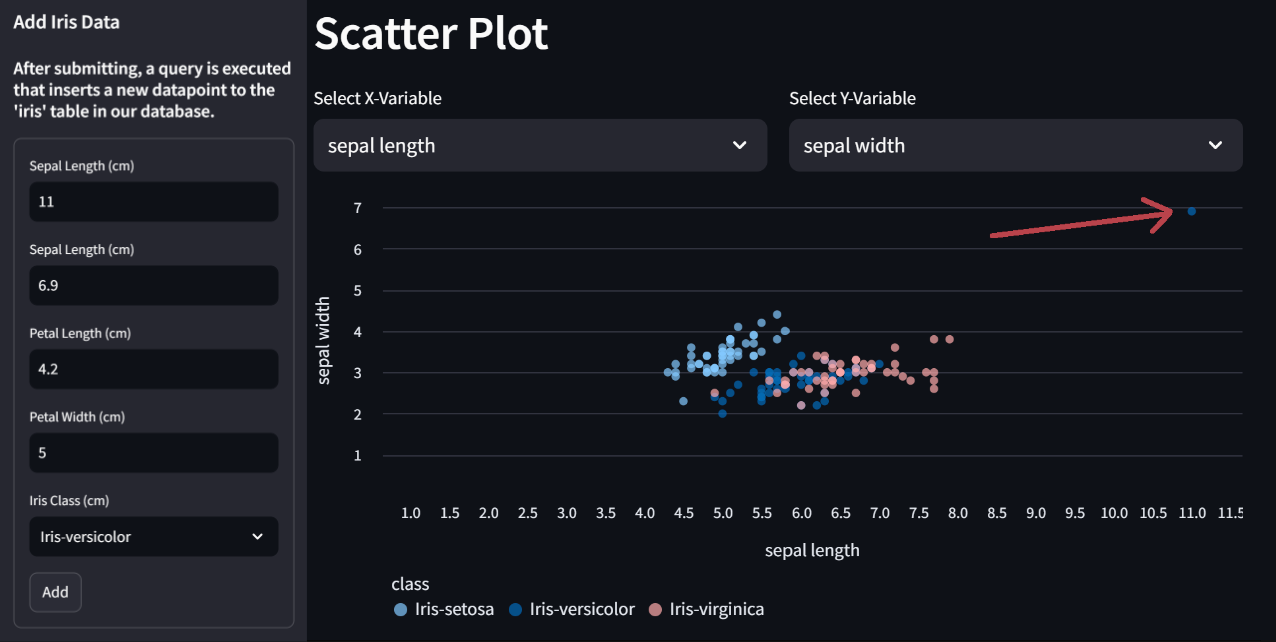
Here is what the form looks like and the scatterplot after we have added this new point. As you can see, the new point on the scatterplot corresponds to the data we just added.
Important Note on SQL Injections It is important to note that web applications which allow users on the internet to execute custom SQL queries onto your personal database are not recommended. There are many risks associated with such a feature including data corruption, data theft, and other unintended consequences that may result from SQL injection attacks. If you would still like to enable users to execute custom queries, it is recommended that you set your database to read-only mode. Also, using parameterized queries such as what we did with this application, is a great way to avoid SQL injection attacks.
Deploy Streamlit Application to Ploomber Cloud
Deploying your Streamlit application onto the Ploomber Cloud is an easy process. Let’s first prepare the files we need to deploy our application. We need a zip folder with the following files:
app.pywhich contains your Streamlit applicationrequirements.txtwhich contains all Python packages used in your app.
Since we are deploying to the cloud, we need to use the database URI as an environment variable. If you are using the demo code, we can do this by setting cloud = True, which tells our program to fetch the DB_URI from the environment.
DB_URI = environ["DB_URI"]
Next, create a Ploomber Cloud account if you have not done so. After logging into your account, you should be redirected to the cloud applications user interface. Optionally, you can also use the Ploomber Cloud command line interface (CLI) to deploy the app if you prefer. Click here for more information.
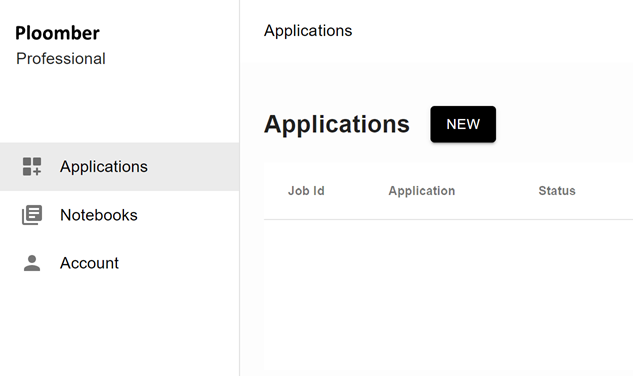
Click on New. If you are a pro user, you can give the application a custom name under the Overview section.
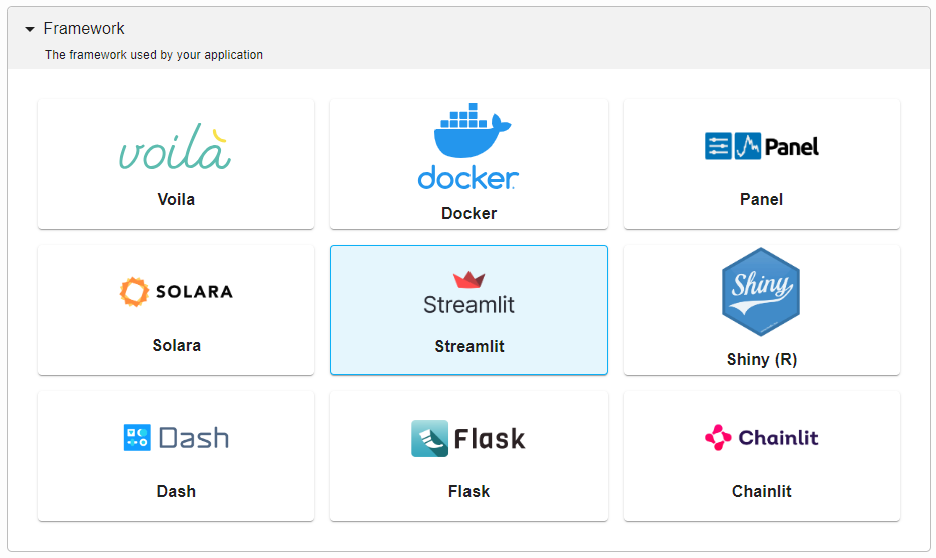
Next, scroll down to the Framework section and select Streamlit.
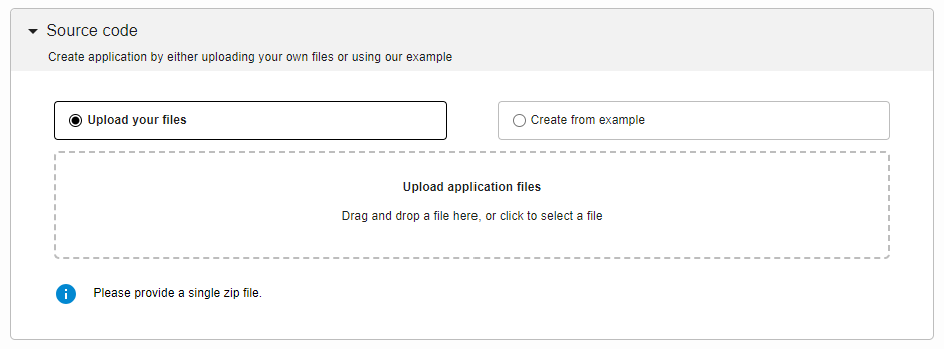
Navigate to the Source code section and upload your zipped folder.
Lastly, and this is the most important part, under the Secrets section, add a new key called DB_URI and paste your DB_URI into the value section.

Now you are done configuring your application! Scroll down and click create and your app should begin deploying automatically. After it is deployed, you can access the application in the given link.
For more information on deploying a Streamlit app, check out the documentation here.
Conclusions
Streamlit can be an incredibly useful tool for companies, data professionals, or project hobbyists to build clean data web applications due to its simplicity and ease of use. In many situations, it is useful to connect a relational database such as PostgreSQL to our application so that we can easily query data from the database into our application. In this blog post, we demonstrated an interesting use case with connecting PostgreSQL to Streamlit where we allow the user to insert data into the database from the web application.
Appendix: Deploying application using Ploomber Cloud CLI
Here are the steps for deploying this application using the CLI.
- Install
ploomber-cloud
pip install ploomber-cloud
- Set your API key
ploomber-cloud key YOURKEY
- Initialize your app
ploomber-cloud init
This will create a ploomber-cloud.json file with your project information.
- Execute
ploomber-cloud deploy
By default, this will compress all the files in your directory and upload it to the cloud. You will then be given a link that looks like https://www.platform.ploomber.io/applications/your-project where you can monitor the deployment of your application.
For more information about the CLI and additional customization you can perform while deploying, check out the CLI documentation here.


